__ Fee paid previously with preliminary materials.
__ Check box if any part of the fee is offset as provided by Exchange Act Rule 0-11(a)(2) and identify the filing for which the offsetting fee was paid previously. Identify the previous filing by registration statement number, or the form or schedule and the date of its filing. |
(1) Amount previously paid:
(2) Form, Schedule or Registration Statement No.:
(3) Filing Party:
(4) Date Filed:

2022 Proxy Statement
Notice of Annual Meeting of Stockholders

NOTICE OF 20192022 ANNUAL MEETING OF STOCKHOLDERS
Dear Stockholders:
It is our pleasure to invite you to join our Board of Directors at our 2019the 2022 Annual Meeting of Stockholders of Greif, Inc. Due to the continued public health impact of the coronavirus (COVID-19), and to support the health and well-being of our employees and stockholders, this year's Annual Meeting will be held as a "completely virtual meeting." You will be able to attend the virtual Annual Meeting and vote your shares via a live webcast by visiting www.virtualshareholdermeeting.com/GEF2022.
DATE AND TIME:
Tuesday, February 26, 2019March 1, 2022
PLACE:
ITEMS OF BUSINESS:
1.To elect ten directors to serve for a one-year term, and
2.To transact such other business as may properly come before the meeting or any adjournments.
RECORD DATE:
Only stockholders of record of the Class B Common Stock at the close of business on December 31, 2018,2021 will be entitled to vote at the Annual Meeting.
VOTING:
We hope that Class B stockholders will promptly vote over the internet, by phone, or by mailing their proxy cards in the enclosed envelope or in person.envelope. Stockholders are always welcome to vote during the virtual meeting.
 Vote by internet at www.proxyvote.com
 Vote by phone at +1 800 690 6903
 Vote by mailing your proxy card
 Vote in person during the virtual meeting
On behalf of the Board of Directors, management and employees of the Company,Greif, thank you for your continued support.
By Order of the Board of Directors,
| /s/ Gary R. Martz | ||||||||
Gary R. Martz | ||||||||
| Corporate Secretary | ||||||||
| January 14, 2022 | ||||||||
Greif - Proxy Statement 2
TABLE OF CONTENTS
| Page | ||||||
| Notice of Annual Meeting of Stockholders | 2 | |||||
| Information About the Annual Meeting | 4 | |||||
| Proposal | 5 | |||||
| Corporate Governance | ||||||
| Skills and Attributes of our Board | 10 | |||||
| Board Responsibilities | 11 | |||||
| Committees of the Board | ||||||
| Board Leadership Structure | ||||||
| Director Independence | 13 | |||||
| Board’s Role in Risk Management Oversight | ||||||
| Availability of Corporate Governance Documents | ||||||
| Director Compensation for Fiscal | ||||||
| Executive Officers of the Company | ||||||
| Stock Holdings of Certain Owners and Management | ||||||
| Compensation Discussion and Analysis | ||||||
| Summary of Executive Compensation Governance Practices | ||||||
| Compensation Committee | ||||||
| Compensation Philosophy and Objectives | ||||||
| Elements of Our Compensation Program | ||||||
| Base Salary | ||||||
| Short-Term Incentive Plan | ||||||
| Long-Term Incentive Plan | ||||||
| Retirement and Deferred Compensation Plans | ||||||
| "Say-on-Pay" Advisory Votes | ||||||
| 31 | ||||||
| 2021 Performance Reviews of CEO and Other NEOs | ||||||
| Compensation Committee Matters | ||||||
| Compensation Committee Report | ||||||
| Executive Compensation Tables | ||||||
| Pay Ratio | ||||||
| Audit Committee Matters | ||||||
| Report of the Audit Committee | ||||||
| Audit Committee Pre-Approval Policy | ||||||
| Fees of the Independent Registered Public Accounting Firm | ||||||
| Other Matters | ||||||
| Stockholder Nominations and Proposals | ||||||
| Certain Relationships and Related Party Transactions | ||||||
Greif - Proxy Statement 3

PROXY STATEMENT
INFORMATION ABOUT THE ANNUAL MEETING:
The 2022 Annual Meeting of Stockholders (the “Annual Meeting”) of Greif, Inc. (the “Company,” “our,” “us” and “we”) will be held on February 26, 2019,March 1, 2022, at 10:8:00 a.m., Eastern Time,Time. This year's Annual Meeting will be held as a virtual meeting via a live webcast at www.virtualshareholdermeeting.com/GEF2022. In order to attend the Company’s principal executive offices, 425 Winter Road, Delaware, Ohio 43015.Annual Meeting, you will need to access the webcast by using your 16-digit control number included on your Notice of Internet Availability or on your proxy card (if you received a printed copy of the proxy materials).
Why am I Receiving these Proxy Materials?
This proxy statement is being furnished to all stockholders of the Company in connection with the Annual Meeting.Meeting and has been made available to you electronically or by mail. It is anticipated that this proxy statement and form of proxy will first be sent to the stockholders on or about January 11, 2019.14, 2022.
Who May Vote at the Annual Meeting?
Only holders of Class B Common Stock as of the close of business on December 31, 2018,2021, are entitled to vote at the Annual Meeting and any adjournment thereof. Holders of Class A stockholdersCommon Stock are not entitled to vote at the Annual Meeting. Therefore, this proxy statement is being furnished to holders of Class A holdersCommon Stock for informational purposes only, and no proxy card is being solicited from them. On the record date of December 31, 2018,2021, there werewere 22,007,725 shares of Class B Common Stock outstanding, with each share entitled to one vote.
How do I Vote?
| VOTE IN ADVANCE OF THE MEETING | VOTE DURING THE MEETING | |||||||||||||
| Via the Internet | By Phone | By Mail | In Person | |||||||||||
| Visit www.proxyvote.com to submit a proxy via computer or your mobile device | Call 1-800-690-6903 24/7 within the United States | Mark, sign and date your proxy card and mail promptly in the enclosed postage-paid envelope. | Attend the Virtual Meeting at www.virtualshareholdermeeting.com/GEF2022 and vote by ballot. | |||||||||||
What Proposals will be Voted on at the Annual Meeting?
At the Annual Meeting, Class B stockholders will vote upon Proposal 1 - the election of nineto elect ten directors to serve for a one-year term. The Class B stockholders will also vote upon such other business as may properly come before the meeting or any adjournments.adjournment.
How are Votes Counted?
Holders of Class B Common Stock represented by properly executed proxies will be voted at the Annual Meeting in accordance with the choices indicated on the proxy. The nineten director nominees receiving the highest number of votes will be elected as directors. Class B stockholders do not have the right to cumulate their votes in the election of directors. Proxies cannot be voted at the Annual Meeting for a number of persons greater than the number of nominees named in this proxy statement. Each share of the Class B Common Stock is entitled to one vote for each director and in respect of Proposal 1. any proposal.
Abstentions will be considered as shares of Class B Common Stock present at the Annual Meeting for purposes of determining the presence of a quorum. Abstentions will not be counted in the votes cast for the election of directors and will not have a positive or negative effect on the outcome of that election.
How do I change or revoke my Vote?
Any proxy may be revoked at any time prior to its exercise by delivering to the Company a subsequently dated proxy or by giving notice of revocation to the Company in writing or in open meeting.writing. A Class B stockholder’s presence at the Annual Meeting does not by itself revoke the proxy.
Voting Instructions to Broker:
If your Class B Common Stock is held in street name, you will need to instruct your broker regarding how to vote your Class B Common Stock. Pursuant to the rules of the New York Stock Exchange, your broker does not have discretion to vote your Class B Common Stock without your instructions with respect to certain matters. If you do not provide your broker with voting instructions, your shares of Class B Common Stock will not be considered present at the Annual Meeting for purposes of determining the presence of a quorum or for voting on such matters.
This Proxy Statement, the form of proxy and the Company’s Annual Report are available at www.proxyvote.com.
Greif - Proxy Statement 4
PROPOSAL 1: Election of Directors
The Nominating and Corporate Governance Committee (the “Nominating Committee”) has recommended the nineten director nominees named below for election as directors at the Annual Meeting. All nineEight of these director nominees are presently serving on our Board of Directors (the “Board”) and eachtwo director nominees are standing for election for the first time. Each nominee has consented to being named in this proxy statement and to serve if elected for a one-year term. Patrick
Michael J. Norton who has served onGasser previously announced that he will retire from the Board forat the past 15 years,end of his current term in office and, therefore, is retiring and not standing for re-election. The sizeBoard would like to acknowledge Mr. Gasser for his over 30 years of service and his significant role in the successful growth of the Company under his leadership. Also as previously announced, Judith D. Hook, a longtime member of the Board, will be reduced from tenpassed away on November 17, 2021. The Board would like to nine directorships prior to the Annual Meeting by virtue of an amendment to the Second Amended and Restated By-Laws, as amended, that was approved by the Board. All nine of these director nominees were identified and proposed as candidatesacknowledge Ms. Hook, for her service on our Board with distinction since 2003. Ms. Hook's passion and vision for Greif, along with her leadership, counsel and friendship will be greatly missed by all.
The two new director nominees are Kimberly Scott and Ole G. Rosgaard.Ms. Scott was identified as a potential director of the Company by a search firm hired by the Nominating Committee, and after a thorough review and interview process, she has been nominated by the Board to serve as a director. Mr. Rosgaard, who will become President and Chief Executive Officer of the Company on February 1, 2022, also has been nominated by the Board to serve as a director.
The eight presently serving director nominees have been nominated to serve as directors based on their record of service and individual contributions to the overall mission and responsibilities of the Board. Unless otherwise specified, the shares of Class B Common Stock represented by the proxies at the Annual Meeting will be voted to elect the nineten director nominees named below. In the event that any of these ten director nominees isare unable to serve (which is not anticipated), the persons named as proxies in the proxy card may vote for another director nominee of their choice. TheThe names and biographies of each of the director nominees for election to the Board of Directors are set forth below.
| Director Nominees | ||
 | |
| PETER G. WATSON | |||||
 | Age: President and Chief Executive Officer (retiring February 1, 2022) Executive Chairman of the Board (effective February 1, 2022) Director since Mr. Watson has been named by the Board to serve as Executive Chairman of the Board of Directors effective February 1, 2022. Mr. Watson has served as President and Chief Executive Officer of the Company since November 2015. Mr. Watson Other Board Service: •Current - Ohio Health Corporation (faith and culture; compensation) •Current - Central Ohio American Heart Association | ||||
Greif - Proxy Statement 5
| OLE G. ROSGAARD | |||||
 | Age: 58 Director Nominee Chief Operating Officer (until January 31, 2022) President and Chief Executive Officer (effective February 1, 2022) Mr. Rosgaard will serve as President and Chief Executive Officer of the Company effective February 1, 2022. Since July 2021, Mr. Rosgaard has served as Chief Operating Officer. From June 2019 to June 2021, he served as Senior Vice President, Group President of Mr. Rosgaard was nominated to Other Board Service: •Current - United Way of | ||||
| VICKI L. | |||||
 | Age: Independent Director since 2004 Compensation Committee member From June 2008 until her retirement in September 2013, Ms. Ms. Avril-Groves was nominated to serve as a director Other Board Service: •Current - Commercial Metals Company (NYSE) (compensation (chair); nominating and corporate governance) •Current - Finning International, Inc. (TSX) (audit; safety, environmental and social responsibility) •Past - Global Brass and Copper Holdings, Inc. (NYSE) (audit; compensation; governance and nominating) | ||||
Greif - Proxy Statement 6
| BRUCE A. EDWARDS | |||||
 | Age: Independent Director since 2006 Audit (Chair) Committee Audit Committee Financial Expert Lead Director (effective March 1, 2022) From March 2008 until his Mr. Edwards Other Board Service: •Current - Gustavus Adophus College (audit) •Current - ODW Logistics •Past - Deutsche Post/DHL (management board) •Past - Ashtead Group PLC (London exchange) (audit; nomination) •Past - Synergy Health PLC (London exchange) (audit; remuneration; nomination) | ||||
| MARK A. EMKES | |||||
 | Age: Independent Director since 2008 Compensation Committee (Chair) member From January 2011 until his retirement in May 2013, Mr. Emkes served as Commissioner of Finance and Administration for the State of Tennessee. Previously, Mr. Emkes was Chairman and Chief Executive Officer of Bridgestone Americas, Inc. and Bridgestone Americas Holdings, Inc., a tire and rubber manufacturing company for more than five years prior to his retirement from that position in February 2010. He was also President of these companies from January 2009 until his retirement. Mr. Emkes Other Board Service: •Current - CoreCivic Corporation (NYSE) (chairman of the •Current - Boy Scouts of •Current - Community Foundation of •Past - First Horizon National Corporation (NYSE) (audit (chair); compensation; information technology) •Past - Clarcor, Inc. (formerly on the | ||||
Greif - Proxy Statement 7
| JOHN F. FINN | |||||
 | Age: Independent Director since 2007 Audit and Nominating Committee member For more than five years, Mr. Finn has been Chairman and Chief Executive Officer of Gardner, Inc., a supply chain management company servicing industrial and consumer customers. Mr. Finn Other Board Service: •Current - J.P. Morgan Asset Management (registered investment company) - (chairman of the board, governance (chair); equity) •Current - Columbus Association for the Performing Arts •Past - Cardinal Health, Inc. (NYSE) (lead director, audit (chair); nominating (chair)) | ||||
| DANIEL J. GUNSETT | |||||
 | Age: Independent Director since 1996 Compensation, Nominating (Chair) and Stock Repurchase Committee For more than five years and until his retirement in December 2020, Mr. Gunsett Mr. Gunsett | ||||
 | Other Board Service: •Past - Recreation Unlimited Foundation |
| JOHN W. MCNAMARA | |||||
 | Age: Independent Director since 2009 Audit and Nominating Committee member Prior to September 2017 and for more than five years, Mr. McNamara | ||||
Greif - Proxy Statement 8
| ROBERT M. PATTERSON | |||||
 | Age: 49 Independent Director since 2020 Audit Committee member Since May 2014, Mr. Patterson has served as President and Chief Executive Officer of Avient Corporation (formerly PolyOne Corporation), a provider of specialty polymer materials, and since May 2016 has also served as its Chairman of the Board. Mr. Patterson has served in various leadership roles with Avient, including Chief Financial Officer, since joining that company in May 2008. Prior to that time, Mr. Patterson served in leadership roles at Novelis, Inc., a manufacturer of aluminum-rolled products, and SPX Corporation, a multi-industry manufacturer and developer. Mr. Patterson was nominated to serve as a director based on his leadership, experience and judgment as a current chief executive officer and chairman of a publicly traded manufacturing company and his hands on management and operations experience in various industries and markets relevant to our products and services. In making its nomination of Mr. Patterson, the Nominating Committee considered his valuable and extensive experience and knowledge in the areas of auditing, finance, global markets, operations, strategic planning, risk management, and mergers and acquisitions, and his experience as chairman of the board of a publicly traded company, which provides experience with corporate governance. Other Board Service: •Current - Avient Corporation (NYSE) (chairman of the board; environmental, health and safety) | ||||
| KIMBERLY SCOTT | |||||
 | Age: 49 Director Nominee Since October 2021, Ms. Scott has served as President and Chief Executive Officer of Aramark Uniform Services, a division of Aramark, a global provider of food, facilities, and uniform services. From January 2021 to September 2021, Ms. Scott served as Chief Operating Officer of Terminix Global Holdings, a provider of residential and commercial pest control services, and from December 2019 to January 2021 she was President of Terminix Residential, a division of Terminix Global Holdings. From July 2018 to September 2019, Ms. Scott was President of Rubicon Global Holdings, a provider of cloud-based waste and recycling solutions. Prior to that time and for more than five years, Ms. Scott served in various leadership roles at Brambles Limited, including President of CHEP North America, a global leader in the provision of reusable pallets, crates and containers and logistic services. Ms. Scott was nominated to serve as a director based on her leadership, experience and judgment as a current division president and chief executive officer of a leading global food, facilities, and uniform service provider and her management and operations experience in various industries and markets relevant to our products and services. In making its nomination of Ms. Scott, the Nominating Committee considered her valuable and extensive experience and knowledge in the areas of manufacturing, supply chain, operations, logistics, strategic planning, global markets, customer service, environmental, risk management, and mergers and acquisitions. Other Board Service: •Past - Rubicon Global Holdings •Past - U.S. Chamber of Commerce •Past - Wharton Initiative for Global Environment Leadership, Wharton School, University of Pennsylvania | ||||
| Board Recommendation | ||
The Board of Directors recommends that the Class B Stockholdersstockholders vote FOR the election of all nominees listed above to the Board of Directors.
Greif - Proxy Statement 9
CORPORATE GOVERNANCE
Board of Directors
The Board currently consists of Directors is currently composed of nineeight independent directors, and one director, Mr. Watson, who asis an employee of the Company and is not independent under the New York Stock Exchange (the "NYSE"("NYSE") listing rules. Mr. NortonSee “Corporate Governance - Board of Directors - Board Leadership Structure" for additional information regarding changes to our Board and management.
| Skills and Attributes of our Board | ||||||||||||||
The Board is retiringcommitted to identifying directors for nomination with the highest ethical values and integrity, mature judgement, unbiased perspective and the sizedeep expertise necessary to provide proper oversight and counsel to the Company. The Board in collaboration with the Nominating Committee regularly evaluates the skills, qualifications and experiences desirable of our Board to successfully achieve our long-term business strategies and serve the interest of our stockholders, customers, employees and communities.
Our directors bring a balanced mix of skills, qualifications and experiences and we believe their varied backgrounds contribute to an effective and well-balanced Board. Listed below is a summary of the Board will be reduced from ten to nine directorships prior to the Annual Meeting by virtuecombined skills and attributes of an amendment to the Second Amended and Restated By-Laws, as amended, that was approved by the Board.our Board:
 Leadership | Directors with senior leadership experience in complex public, private and government organizations, whether as an officer or board member, are better able to oversee the management of the Company. This experience also brings perspective in analyzing, shaping and overseeing the execution of important operational issues and developing strategy and methods to drive change and growth. Directors with leadership experience generally possess strong abilities to motivate and manage others and to recognize and develop leadership skills in others. | |||||||||||||
 Governance/ Board Service | Directors with corporate governance experience gained from service on company boards provide valuable insight into the dynamics and operations of the Board and the impact that governance and compensation decisions have on the Company and stockholders. This supports the Company's goals of strong corporate governance practices through Board and management accountability, transparency, legal and regulatory compliance and protection of stockholder interests. | |||||||||||||
 International | Directors with international or global markets experience bring valuable knowledge and perspective of global industry dynamics to the Company, including exposure to different cultural perspectives and practices and different political and regulatory environments. This provides critical insight into the scope of opportunities and risk related to our international operations. | |||||||||||||
 Manufacturing/ Supply Chain | Directors with experience and responsibility for managing or overseeing the manufacturing operations and supply chain logistics of a company gain extensive experience with maximizing operational performance and efficiencies while managing expenses and can provide insight and guidance in connection with strategy to deliver cost savings and fuel growth through sustainable means. | |||||||||||||
 Accounting/ Finance | Directors with an understanding of accounting, financial reporting, capital allocation processes and financial markets are essential to ensuring effective oversight of the Company's financial resources and processes and providing valuable advice and insights with respect to establishing a successful capital strategy critical to our ongoing success. | |||||||||||||
 Strategy/ M&A | Directors with strategic planning and merger and acquisition experience are able to provide insight as we identify the best strategic manner in which to expand our business and drive growth either through innovative strategic initiatives or acquisitions and other business ventures. Such individuals can provide valuable guidance on how to develop a strategic plan and oversee the execution of key strategic initiatives and evaluating our progress of those initiatives. | |||||||||||||
 Risk Management | Directors with risk management and compliance oversight experience can provide valuable insight and guide the Board and management in executing its responsibilities to identify, evaluate and understand the various risks and the magnitude of those risks facing the Company and ensure there are appropriate policies and procedures in place to effectively mitigate and manage those risks. | |||||||||||||
 Government/ Legal | Directors with government and legal experience have valuable insight into the key issues the Company faces with navigating and complying with legal reporting requirements and governmental and regulatory affairs in a complex global economy. | |||||||||||||
Greif - Proxy Statement 10
| Board Responsibilities | ||||||||||||||
The Board oversees, counsels and directs management in the long-term interest of our stockholders. The primary responsibilities of the Board and committees include:
•Strategy: The Board actively works with management to develop annual and long-term strategies for the Company. The Board evaluates, approves and monitors the achievement of our business, strategic and financial objectives, plans and actions.
•Leadership and Succession Planning: The Board and the Nominating Committee are responsible for the selection and evaluation of our directors for election to the Board and oversee Board succession planning, and the Board and the Compensation Committee oversee the succession planning process for the Chief Executive Officer and other senior executive officers.
•Operating Performance: The Board regularly monitors our operational execution and financial performance, and discusses improvements and changes when appropriate. The Board holds management accountable for the execution of our strategic plans. The Board and the Audit Committee also work with management in the assessment and mitigation of our major risk factors.
•Governance: The Board and its committees oversee the establishment, implementation and maintenance of policies, practices and procedures to ensure that our business is conducted with the highest standards of ethical conduct and in conformity with applicable laws.
•Sustainability: The Board and the Nominating Committee monitor environmental, social and governance related issues and the Company's sustainability strategies.
| Committees of the Board | ||
The Board currently has the following committees:
| AUDIT COMMITTEE | |||||
Members: Bruce A. Edwards (Chair/Financial Expert) John F. Finn John W. McNamara Robert M. Patterson | Primary Responsibilities: •Reviews critical audit matters •Reviews and approves related party transactions | ||||
COMPENSATION COMMITTEE | |||||
Members: Vicki L. | Primary Responsibilities: •Reviews at least annually our incentive compensation and equity-based compensation plans, including their design and implementation | ||||
Greif - Proxy Statement 11
NOMINATING AND CORPORATE GOVERNANCE COMMITTEE | |||||
Members: John F. Finn Michael J. Gasser | Primary Responsibilities: •Administers and oversees the annual Board and Committee evaluation process •Reviews and recommends to the Board changes to our corporate governance guidelines | ||||
STOCK REPURCHASE COMMITTEE 0 meetings in fiscal | |||||
Members: Michael J. Gasser (Chair) Daniel J. Gunsett | Primary Responsibilities: | ||||
The Board held sixfive meetings during fiscal 20182021 and all directors attended at least 75 percent of the total number of meetings of the Board of Directors and committees on which he or she served. Under our Corporate Governance Guidelines, directors are expected to attend our Annual Meeting. All of the director nomineescurrent directors attended the 2018 Annual Meeting.
2021 virtual annual meeting.
| Board Leadership Structure | ||
Our Board is the ultimate decision-making body of the Company, except for those matters reserved to or shared with the stockholders. The day-to-day business is conducted and managed by the management of the Company under the direction of the Chief Executive Officer (“CEO”). Currently, ourOur current Board leadership structure consists of an independenta Chairman of the Board, Mr. Gasser a former CEO, seven additional independent directors and one management director, Mr. Watson, who is our former CEO (Mr. Gasser), eight additional independent directors (seven followingcurrent CEO. With the Annual Meeting) andretirement of Mr. Gasser as a director whoat the end of his current term in office, along with Mr. Watson's retirement as CEO and Mr. Rosgaard's succession to such office on February 1, 2022, the Board is implementing a new Board leadership structure. On February 1, 2022, Mr. Watson will become Executive Chairman of the current CEO (Mr. Watson).Board, and on March 1, 2022, the date of our Annual Meeting, Mr. Edwards will become the Lead Director for the Board and Mr. Rosgaard will join the Board as a management director, in each case, assuming their respective elections.
Our Board believes this new Board leadership structure is appropriatewill be a more effective structure for the Company at this time.going forward. This structure permitswill permit Mr. WatsonRosgaard to primarily focus his time and attention on the business operations, while Mr. Gasser directsWatson as Executive Chairman of the Board, will direct his attention on guiding the Board’s agenda inand setting priorities for the Company to strategically address the risksopportunities and challenges faced by the Company. Further, our Mr. Edwards, as the Lead Director, will support the Executive Chairman of the Board and act as a liaison for the independent directors. Our Board believes that itthis new structure is in the best interests of the stockholders forour stockholders. Mr. GasserWatson is uniquely qualified to serve as Executive Chairman of the Board due to his extensive knowledge of the Company based on his 17six years of experience as our CEO and as an executive officer of the former CEO. While this structure has worked particularly wellCompany for over ten years. Mr. Rosgaard, as our Board, it is notnew CEO, will have extensive insight into the Company's current opportunities and challenges. Mr. Edwards tenure as director of the Company and his service in a permanent structure. variety of roles as an independent director and business leader of other companies will add valuable insight as the Lead Director. It is the Board’s belief that no single organizational model is best or most effective in all circumstances. Therefore, although the Board has determined that this new Board leadership structure will be the current structure works bestmost effective for the Company at this time, the Board may implement another structure if deemed to be appropriate in the future.
•The majority of the Board must be independent of management and have no material relationship with the Company, either directly or indirectly as a partner, stockholder or officer of an organization that has such a relationship with the Company, and must meet the standards of independence under the applicable rules of the SEC and NYSE listing standards.
•Only independent directors are members of the Compensation, Audit and Nominating Committees.
•Independent/non-management directors meet at least four times each year, and during at least one of those meetings, the non-management directors schedule an executive session that includes only independent directors.
Greif - Proxy Statement 12
| Director Independence | ||
Pursuant to NYSE rules, in order for a director to qualify as “independent,” the Board andmust affirmatively determine that the Nominating Committee have assembled a Boarddirector has no material relationship with the Company that consists of capable and experienced directors, many of whom are currently or have been leaders of companies, who are independent thinkers and have a wide range of expertise and skills.would impair the director’s independence. The Board currently does not have a lead director. However, becausehas adopted categorical standards to assist it in making its determination of its capable and experienced independent directors, including its Chairman of the Board, and for the reasons described above, along with the above described policies that promote an open discussion among the independent directors, the Chairman of the Board and the CEO, thedirector independence.
The Board has determined that all current directors and director nominees have no material relationship with the Company and, therefore, are independent, except for Messrs. Watson and Rosgaard. Mr. Watson is currently the CEO of the Company. Mr. Rosgaard is currently the Chief Operating Officer of the Company and Mr. Watson's successor as CEO. The Board has determined that Mr. Gunsett is independent because fees for legal services rendered by Baker & Hostetler LLP, where Mr. Gunsett was a lead director ispartner during two months of fiscal 2021, were not necessary at this time.
material to the Company or to that firm during fiscal 2021 and the nature of the relationship has been properly disclosed to the Board. Mr. Gunsett retired from Baker & Hostetler LLP in December 2020.
| Board’s Role in Risk Management Oversight | ||
The Board takes an active role in the oversight of our most significant risks. The Board executes its risk oversight function at the Board level and through delegation to its Board committees. The Board does not view risk in isolation. Risks are considered in virtually every business decision and as part of our business strategy. The Board recognizes it is neither possible nor prudent to eliminate all risk. Purposeful and appropriate risk-taking is essential for us to be competitive and to achieve our long-term strategic objectives.
Our Board has been and continues to be engaged with management in the oversight of the impact of COVID-19 on the Company and the Company’s actions in response. The Board continues to identify and monitor potential risks and ensure effective oversight.
While the Board and its committees oversee risk management, management is responsible for day-to-day management of the various enterprise risks facing the Company. Management has developed and administers a formal enterprise risk management program that is a Company-wide effort involving both the Board and management. Management’s role is to identify, mitigate, guide and review the efforts of our business units with respect to risk, consider whether various risks are acceptable, and approve plans to deal with critical business risks that could prevent achievement of our business goals or plans. The Board receives detailed management reports that assess the material risk to us, including strategic, operational, financial, infrastructure, legal, regulatory and other external risks facing the Company and to be certainensure that management develops and maintains comprehensive risk management policies and procedures to assess, mitigate and monitor those risks. The risk oversight responsibilities of the Board and its committees risk oversight responsibilities are summarized below:
| Board of Directors | Audit Committee | Compensation Committee | Nominating Committee | |||||||||||||||||
Reviews related party transactions | ||||||||||||||||||||
Greif - Proxy Statement 13
The non-management directorsBoard believes that the pursuit of sustainability efforts is important to our stakeholders and should be one our strategic priorities. Sustainability efforts are pursued through an environmental, social and governance (“ESG”) framework and extend to all levels of our organization in support of our ongoing business strategy. The Board takes an active role in the oversight of ESG matters with the assistance of the Company meet withoutNominating Committee. The Nominating Committee evaluates and reviews the Company's policies, activities and programs related to ESG matters and makes recommendations to the Board. The Nominating Committee also monitors and evaluates emergent ESG related issues, risks and trends that could affect the Company's business activities and performance, and reviews and assesses the Company's progress against relevant external ESG and other sustainability indices and the Company's short-term and long-term ESG goals.
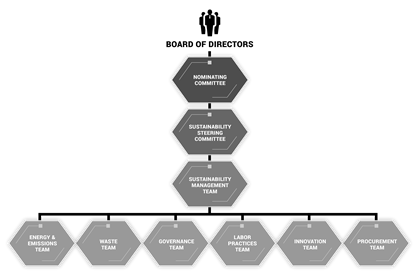
Our Sustainability Steering Committee is tasked with further integrating sustainability into our managementstrategy and operations, reviewing our sustainability progress and priorities quarterly, and ensuring accountability at least four times each year, and during at least one of those meetings, the non-management directors schedule an executive session that includes only independent directors. These meetings are typically held in conjunction with a regularly scheduled Board meeting and at such other times as necessary or appropriate. The chairpersonsall levels of our Auditorganization. Our Sustainability Steering Committee Compensation Committeemeets with the leaders of our ESG global teams that comprise the sustainability management team, who on a quarterly basis are responsible for tracking the level of achievement of our global sustainability targets. The steering committee guides the activities of our sustainability management team, which works with topic teams consisting of representatives from each of our business regions and Nominating Committee rotateunits to drive facility level projects and priorities.
Our long-term sustainability strategies include reducing our emissions to combat climate change, producing innovative products that complement our sustainability efforts, collaborating with customers to help them reduce the impact of their packaging on the environment and to assist them in meeting their decarbonization goals, and expanding our end-of-life solutions and recycling capabilities to contribute further to the growing circular economy. The Company is also actively advancing programs to create an even safer, more diverse, equitable and inclusive workforce setting where all colleagues can grow and thrive.
We published our first sustainability report in 2009 and issued our 12th consecutive sustainability report in April 2021, which was based on our fiscal year performance ending October 31, 2020. The report provides our 2025 sustainability goals and highlights progress and strategies underway to achieve those goals. Our sustainability report is prepared in accordance with the Global Reporting Initiative Standards which includes, Core Option, SASB Application Guidance and fulfills the United Nations Global Compact annual Communication on Progress. We also aligned our climate-related disclosures with recommendations from the Task Force on Climate-related Financial Disclosures. Our 2020 report is available in full at https://sustainability.greif.com/report-downloads/.
Notable sustainability highlights include the following as chairperson of meetings of the non-management directors.October 31, 2021:
Greif - Proxy Statement 14
| Social | Governance | |||||||
 |  |  | ||||||
| Highlights | ||||||||
•4.5 million containers reconditioned and recycled in 2020 (86,064 metric tons virgin materials saved) •Approximately 3.4 million tons of recycled fiber collected, brokered and/or processed in 2020 •Over 90 percent of the fiber used in our paper manufacturing operations is derived from purely recycled inputs •Surpassed 2020 greenhouse gas ("GHG") emissions target (reduced emissions by 11% per unit of production from 2014 baseline) •Announced a new target to reduce absolute Scope 1 and 2 GHG emissions by 28% by 2030. This target aligns to the prevailing climate science limit of keeping global warming to well below two degrees Celsius •At least 48 facilities achieved zero waste to landfill in 2021 and diverted 85% of waste from landfills in 2021 •0.74 lost workday case rate in 2020, a 23% decrease since 2013 •Conducted an internal human rights assessment in 83 facilities within 23 countries in both 2020 and 2021 •Rated in the 90th percentile among all manufacturing companies in 2021 (Gallup Q12 Engagement Survey) •20% female representation on the Board of Directors and 23% female representation in our global workforce •Member of the World Business Council for Sustainable Development since 2008 •Signatory of United Nation Global Compact since 2016 •Member of the Alliance to End Plastic Waste in 2021 | ||||||||
| Awards | ||||||||
•Awarded a Gold recognition from EcoVadis for the third consecutive year in 2020 (top 3% of all companies assessed) •ESG rating of “A” by MSCI ESG Research LLC in 2021 •Received Prime status in 2020 by ISS ESG •Recognized by Newsweek as one of America’s Most Responsible Companies in 2021 | ||||||||
| Availability of Corporate Governance Documents | ||
Each of the Corporate Governance Documents are posted on our website at www.greif.com under “Investors-Corporate Governance-Governance Documents.” Copies of each of the Corporate Governance Documents are also available in print to any stockholder of the Company, without charge, by making a written request to the Company. Requests should be directed to Greif, Inc., Attention: Secretary, 425 Winter Road, Delaware, Ohio 43015.
Greif - Proxy Statement 15
Director Compensation for Fiscal 20182021
The following table sets forth the compensation of our directors for fiscal 2018:2021:
Name (1) | Fees ($) | Stock Awards ($) (2) | All Other Compensation ($) (3) | Total ($) | ||||||||||
Michael J. Gasser | 234,534 | 134,965 | 3,600 | 373,099 | ||||||||||
| Vicki L. Avril-Groves | 103,284 | 134,965 | — | 238,249 | ||||||||||
| Bruce A. Edwards | 116,784 | 134,965 | 1,500 | 253,249 | ||||||||||
| Mark A. Emkes | 121,284 | 134,965 | — | 256,249 | ||||||||||
| John F. Finn | 107,534 | 134,965 | 1,500 | 243,999 | ||||||||||
| Daniel J. Gunsett | 122,034 | 134,965 | 6,600 | 263,599 | ||||||||||
| Judith Hook | 105,784 | 134,965 | — | 240,749 | ||||||||||
John W. McNamara | 106,534 | 134,965 | 3,600 | 245,099 | ||||||||||
| Robert M. Patterson | 100,284 | 134,965 | — | 235,249 | ||||||||||
| Name (1) | Fees ($) | Stock Awards ($) (2) | All Other Compensation ($) | Total ($) | |
| Michael J. Gasser | 231,260 | 134,990 | — | 366,250 | |
| Vicki L. Avril | 89,010 | 134,990 | — | 224,000 | |
| Bruce A. Edwards | 102,510 | 134,990 | — | 237,500 | |
| Mark A. Emkes | 89,010 | 134,990 | — | 224,000 | |
| John F. Finn | 92,510 | 134,990 | — | 227,500 | |
Daniel J. Gunsett (3) | 109,010 | 134,990 | 3,000 | 247,000 | |
| Judith Hook | 104,010 | 134,990 | — | 239,000 | |
| John W. McNamara | 87,510 | 134,990 | — | 222,500 | |
Patrick J. Norton (4) | 89,010 | 134,990 | 10,000 | 234,000 | |
(2)Amounts in this column represent the dollar amount recognized for financial statement reporting purposes during fiscal 2021 computed in accordance with Accounting Standards Certification (“ASC”) 718 and represents the cash value of the total number of restricted shares of Class A Common Stock awarded to such director during fiscal 2021 under our 2005 Outside Directors Equity Award Plan (2,854 shares per outside director as of the 2021 annual meeting). The amounts reported reflect the closing price of our shares of Class A Common Stock on February 22, 2021 ($47.29), the day preceding the date on which the shares were granted. For a discussion of the relevant ASC 718 valuation assumptions, see Note 1 of the Notes to the Consolidated Financial Statements included in Item 8 of our Annual Report on Form 10-K for fiscal 2021 (the "2021 Form 10-K”).
As of October 31, 2018,2021, each outside director owned 9,1489,468 shares of Class A Common Stock that had been awarded to him or her under the above plan that were subject to restrictions on transfer. (Fortransfer except for Mr. Patterson who owned 2,854 shares. For the aggregate number of restricted and non-restricted shares of Class A and Class B stockCommon Stock beneficially owned by each of the outside directors, see “Security Ownership of Certain Beneficial Owners and Management.”) No stock options have been awarded to any outside directorsdirector since 2005 and no stock options remainare outstanding.
(3)All Other Compensation for Messrs. Gasser and McNamara represent the amount paid by the Company for an annual wellness physical. All Other Compensation for Messrs. Edwards and Finn represent the amount paid by the Company for strategy advisory work. All Other Compensation for Mr. Gunsett represents his receipt of $3,000 for administering the annual Board and committee evaluations during fiscal 2021 and $3,600 paid by the Company for an annual wellness physical.
| Director Compensation Arrangements | ||
The Compensation Committee is responsible for setting the overall compensation strategy and policies for our outside directors. Directors who also serve as employees for the Company or any of its subsidiaries are not compensated for their service as a director. Directors may also receive additional compensation for performing duties assigned by the Board or its committees that are considered beyond the scope of the ordinary responsibilities of a director or committee member.
In fiscal 2017,June 2021, the Compensation Committee, working with its compensation consultant, Willis Towers Watson, conducted a director compensation market survey. Based on the market survey information, the Compensation Committee approved changing the per meeting fee structure to an annual retainer fee structure, which became effective for all payments made to directors starting in July 2021. However, if the number of meetings for the Board or any individual committee exceeds eight during the fiscal year, the Compensation Committee will provide equitable compensation for the extra meetings.
Accordingly, during fiscal 2021, compensation to directors was paid under two different fee arrangements as set forth below. The annual cash retainers were paid in equal quarterly installments, as applicable, and the stock award is issued annually at the annual stockholders meeting.
| November 1, 2020 - June 30, 2021 | July 1, 2021 - October 31, 2021 | |||||||||||||
| Board of Director Fees | Board Annual Retainer | Stock Award | Board Annual Retainer | Stock Award | ||||||||||
| Chairman of the Board | $215,000 | $135,000 | $240,000 | $142,000 | ||||||||||
| All Other Outside Directors | $75,000 | $135,000 | $100,000 | $142,000 | ||||||||||
| Committee Meeting Fees | Committee Meeting Attendance | Chair Annual Retainer | Committee Annual Retainer | Chair Annual Retainer | ||||||||||
| Audit | $1,500 | $15,000 | $10,000 | $20,000 | ||||||||||
| Compensation | $1,500 | $15,000 | $10,000 | $20,000 | ||||||||||
| Nominating | $1,250 | $10,000 | $5,000 | $15,000 | ||||||||||
Greif - Proxy Statement 16
The Compensation Committee determined to increase the compensation of our outside directors beginning on January 1, 2018. The changes to our outside director compensation are as follows:
In addition to the compensation described above, we provide a health and wellness program for our outside directors which includes annual physical exams and we reimburse outside directors for expenses incurred to attend Board and committee meetings. We offer no other perquisites to our outside directors.
| Stock Ownership Guidelines for Directors | ||
Each outside director is required to own a minimum of five times his or her annual retainer in shares of Company common stock after five years of service as a director. Restricted shares of Class A Common Stock awarded to an outside director under our 2005 Outside Directors Equity Award Plan and the receipt of which has been deferred at the election of such outside director under the terms of the Directors Deferred Compensation Plan are counted as owned by the deferring outside director for purposes of these stock ownership guidelines. The Board evaluates whether exceptions should be made in the case of any outside director who, due to his or her unique financial circumstances, would incur a hardship by complying with these requirements. All current outside directors are currently in compliance with theseour stock ownership guidelines.
| Director Participation in Directors Deferred Compensation Plan | ||
The plan is considered to be an “unfunded” arrangement as amounts generally willare not be set aside or held by the Company in a trust, escrow, or similar account. Amounts deferredNotwithstanding the foregoing, deferrals of restricted stock are held in a "rabbi trust" established by the Company. Deferrals of cash compensation under the plan are credited to a participant’s account under the plan. For cash compensation deferrals, the value of the cash compensation is creditedplan as “Phantom Shares.” “Phantom Shares” have a value equal to the market value from time to time of shares of our Class A Common Stock, without par value.Stock. The number of Phantom Shares credited to a participant’s account is based on the dollar amount of deferral, divided by the then current per share value of our shares of Class A Common Stock. If a dividend is declared and credited on shares of our Class A Common Stock, without par value. Restricted stock the receiptPhantom Shares are credited with a corresponding dividend in the form of which is to be deferred is held in a so-called “rabbi” trust established by the Company.additional Phantom Shares within sixty days of that date. Dividends paid on shares of restricted stock held in the rabbi trust are contributed to the rabbi trust and are paid from the rabbi trust to the participants and are not accumulated in the rabbi trust.
•Cash compensation deferrals (credited as Phantom Shares) in a single lump sum payment, or annual installments over a five-year period or a series of five yearstwo payments. Depending on the form of payment elected, a participant may choose a fixed date for distribution or ten years or two payments on fixed dates, upon the earlier of a fixed date or such participant's termination of Board membership for any reason ormembership. If a Participant elects to receive a series of two payments, the participant must specify a fixed date for each payment and must specify the percentage of his or her cash compensation deferral to be paid on each specified date.
•Restricted stock deferrals upon termination of Board membership for any reason orupon: (a) a fixed date that is at least three years after the date of the restricted stock award,is awarded; or (b) the earlier of (i) a fixed date that is at least three years after the date of the restricted stock award and is awarded, or (ii) the participant’s termination offrom Board membership for any reason.membership.
Greif - Proxy Statement 17
Executive Officers of the Company
The following information relates to executive officers of the Company as of the date of this proxy statement (elected annually):
| Name | Age (1) | Positions and Offices | Year first became executive officer | ||||||||
| Peter G. Watson | 65 | President and Chief Executive Officer | 2011 | ||||||||
| Lawrence A. Hilsheimer | 64 | Executive Vice President, Chief Financial Officer | 2014 | ||||||||
| Ole G. Rosgaard | 59 | Chief Operating Officer | 2015 | ||||||||
| Gary R. Martz | 63 | Executive Vice President, General Counsel and Secretary | 2002 | ||||||||
| Bala V. Sathyanarayanan | 51 | Executive Vice President and Chief Human Resources Officer | 2018 | ||||||||
| Timothy L. Bergwall | 57 | Senior Vice President and Group President, Paper Packaging & Services and Soterra LLC | 2014 | ||||||||
| Michael Cronin | 64 | Senior Vice President, Enterprise Strategy and Global Sourcing, and Supply Chain | 2015 | ||||||||
| Douglas W. Lingrel | 58 | Vice President and Chief Administrative Officer | 2010 | ||||||||
| Patrick G. Mullaney | 52 | Vice President and Group President, Global Industrial Packaging | 2022 | ||||||||
| Kimberly A. Kellermann | 45 | Vice President, Global Operations Group | 2022 | ||||||||
| Tina R. Schoner | 54 | Chief Supply Chain Officer | 2022 | ||||||||
| Matthew D. Eichmann | 43 | Vice President, Investor Relations, External Relations and Sustainability | 2022 | ||||||||
| David C. Lloyd | 52 | Vice President, Controller and Treasurer | 2014 | ||||||||
| Name | Age (1) | Positions and Offices | Year first became executive officer |
| Peter G. Watson | 62 | President and Chief Executive Officer | 2011 |
| Lawrence A. Hilsheimer | 61 | Executive Vice President and Chief Financial Officer | 2014 |
| Gary R. Martz | 60 | Executive Vice President, General Counsel and Secretary | 2002 |
| Michael Cronin | 61 | Senior Vice President and Group President, RIPS EMEA and APAC, GPA and Global Key Accounts | 2015 |
| Ole G. Rosgaard | 55 | Senior Vice President and Group President, RIPS Americas and Global Sustainability | 2015 |
| Bala V. Sathyanarayanan | 48 | Senior Vice President and Chief Human Resources Officer | 2018 |
| Timothy L. Bergwall | 54 | Vice President and Group President, Paper Packaging & Services and Soterra LLC | 2014 |
| Hari K. Kumar | 56 | Vice President and Division President, Flexible Products & Services | 2016 |
| Douglas W. Lingrel | 55 | Vice President and Chief Administrative Officer | 2010 |
| David C. Lloyd | 49 | Vice President, Corporate Financial Controller and Treasurer | 2014 |
| Christopher E. Luffler | 43 | Vice President, Business Managerial Controller | 2014 |
Peter G. Watson hashas served as President and Chief Executive Officer since November 2015. From January 2014 to October 2015, Mr. Watson served as Chief Operating Officer. From September 2012 until December 2013, Mr. Watson served asPrior to that time, and for more than five years, he held various leadership roles within the Company including Vice President and Group President, Paper Packaging & Services, Global Sourcing and Supply Chain and Greif Business System. From May 2013 until May 2015,System and President of Soterra. Mr. Watson also servedwill be retiring as President of Soterra LLC, which operates our Land Management business segment. From January 2010and Chief Executive Officer on February 1, 2022 and will transition to September 2012, he served as Vice President and Division President, Paper Packaging & Services. Prior to January 2010 and for more than five years, Mr. Watson served many roles in our Paper Packaging & Services segment including President of CorrChoice (a divisionExecutive Chairman of the Company).Board effective February 1, 2022. See "Proposal 1: Election of Directors."
Lawrence A. Hilsheimer has served as Executive Vice President and Chief Financial Officer since May 2014. From April 2013 to April 2014, Mr. Hilsheimer was executive vice president and chief financial officer of The Scotts Miracle-Gro Company. From August 2012 to March 2013, Mr. Hilsheimer was the president and chief operating officer of Nationwide Retirement Plans, a division of Nationwide Mutual Insurance Company. From January 2010 to July 2012, Mr. Hilsheimer was the president and chief operating officer of Nationwide Direct & Customer Solutions, also a division of Nationwide Mutual Insurance Company. For the two years prior to that time, he was executive vice president and chief financial officer of Nationwide Mutual Insurance Company. Prior to joining Nationwide, he was vice chairman and regional managing partner for Deloitte & ToucheTouché USA, LLP, which included serving on the board of directors of the Deloitte Foundation. Mr. Hilsheimer is a director and chair of the audit committee and member of the Audit Committeenominating committee of Installed Building Products, Inc., a publicly traded (NYSE) installer of insulation products.products, and is the lead independent director and chair of the audit committee of Root, Inc., a publicly traded (Nasdaq) technology-based insurance company.
Ole G. Rosgaard has served as Chief Operating Officer since July 2021. From June 2019 to June 2021, he served as Senior Vice President, Group President of Global Industrial Packaging and from June 2019 to September 2020, Mr. Rosgaard was also responsible for Global Sustainability. From June 2017 to June 2019, Mr. Rosgaard served as Senior Vice President and Group President, Rigid Industrial Packaging & Services ("RIPS") - Americas and Global Sustainability. From August 2015 to June 2017, he served as Vice President and Division President, RIPS-North America. In January 2016, he assumed additional responsibility for RIPS-Latin America and Container Life Cycle Management LLC, a joint venture that operates our North American reconditioning business. Prior to joining the Company, and for more than five years, he served in various roles of increasing responsibility with Icopal a/s, a designer, manufacturer and installer of high end roofing solutions, including managing director in Denmark, group managing director/chief executive officer of the West European Region and group managing director/chief executive officer of the Central European Region. Mr. Rosgaard will become President and Chief Executive Officer of the Company on February 1, 2022.
Gary R. Martz has served as Executive Vice President since June 2010 (and prior to that as Senior Vice President) and as General Counsel and Secretary since joining the Company in 2002. From March 2014 until May 2014, Mr. Martz also served as Chief Administrative Officer, and from March 2018 until November 2018, served as acting Chief Human Resources Officer. Since May 2014, Mr. Martz has assumed responsibility for the management of our global real estate services department. From June 2005 until May 2013, Mr. Martz served as President of Soterra LLC. Prior to 2002,joining the Company, he was a partner in the law firm of Baker & Hostetler LLP.
Bala V. Sathyanarayananhas served as Executive Vice President and Chief Human Resource officer since July 2021. From November 2018 to June 2021, Mr. Sathyanarayanan was Senior Vice President and Chief Human Resources Officer. From January 2017 to October 2018, Mr. Sathyanarayanan served as executive vice president, human resources, North American Operations, for the Xerox Corporation. From July 2012 to January 2017, Mr. Sathyanarayanan was vice president, business transformation and human resources, Xerox Technology, a provider of print and ditigial document products and services. Prior to joining Xerox Corporation, and for
Greif - Proxy Statement 18
more than five years, Mr. Sathyanarayanan served in various human resource roles at Hewlett-Packard Inc., a global provider of personal computers and printers and printing solutions.
Timothy L. Bergwallhas served as Senior Vice President since February 2019, and as Group President of Paper Packaging & Services and President of Soterra LLC since May 2015. Prior to that and since 2014, Mr. Bergwall had served as Vice President and Division President, Paper Packaging & Services. Prior to that time and for more than five years, Mr. Bergwall served as Vice President, Containerboard Mills.
Michael Cronin has served as Senior Vice President, Enterprise Strategy, Global Sourcing and Supply Chain since September 2019. Prior to that and since May 2015, Mr. Cronin served as Senior Vice President and Group President, Rigid Industrial Packaging & Services (RIPS)-EMEA since joiningRIPS - EMEA in addition to the Company in May 2015. In January 2016,additional responsibilities he assumed additional responsibility for RIPS-APAC, Greif Packaging Accessories and Global Key Accounts.Accounts in January 2016. From February 2013 to February 2014, Mr. Cronin was chief executive officer of Coveris Packaging, a global manufacturer and distributor of packaging solutions and coated film technologies. From March 2010 to August 2012, Mr. Cronin was the president of the packaging division of SCA Hygiene Products, a Swedish consumer goods company and pulp and paper manufacturer. From January 2003 to January 2010, Mr. Cronin was the president of the European packaging division of Rio Tinto Alcan, a global mining company.
Douglas W. Lingrel has served as Vice President and Chief Administrative Officer since June 2016. From February 2009 to June 2016, Mr. Lingrel served as Chief Information Officer. From 2005 to 2009, Mr. Lingrel served as Vice President, Global Supply Chain Process and Administration.
Patrick G. Mullaney has served as Vice President and Group President, Global Industrial Packaging since November 2021. From September 2019 to October 2021, Mr. Mullaney served as Vice President, General Manager of Global Industrial Packaging - EMEA. From June 2017 to August 2019, Mr. Mullaney served as Director - Rigid Industrial Packaging & Services - EMEA Western Region and from June 2017 to September 2018, he served as Manager - Rigid Industrial Packaging & Services - EMEA Central Region. Prior to that time and for more than five years, he served in various roles at Clondalkin Group, including chief executive officer of Clondalkin Flexible Packaging, an international producer of value-added packaging products and services. Mr. Mullaney has been appointed by the Board as an executive officer effective February 1, 2022, and will serve as Senior Vice President, Group President, Global Industrial Packaging.
Kimberly A. Kellermann has served as Vice President, Global Operations since September 2019. From July 2017 to September 2019, Ms. Kellermann served as Vice President of Operations, and from September 2017 to September 2019, she held additional responsibilities in the areas of environmental, health and safety. Prior to that time and for more than five years, Ms. Kellermann served as vice president operations at West-Ward Pharmaceuticals (formerly Boehringer Ingelheim Roxane Laboratories), an international pharmaceutical company. Ms. Kellermann has been appointed by the Board as an executive officer effective February 1, 2022, and will serve as Senior Vice President, Global Operations Group.
Tina R. Schonerhas served as Chief Supply Chain Officer since joining the Company in January 2022. From November 2017 to May 2021, Ms. Schoner served as senior vice president and chief procurement officer at Oshkosh Corporation, a heavy industrial manufacturer of specialty vehicles and worksite access equipment. From January 2015 to November 2017, Ms. Schoner served as executive director of supply chain operations and strategic sourcing for Raytheon Technologies Corporation (formerly United Technologies Corporation), a global provider of high-technology products and services to building systems and aerospace industries. Ms. Schoner has been appointed by the Board as an executive officer effective February 1, 2022, and will serve as Senior Vice President, Chief Supply Chain Officer.
Matthew D. Eichmann has served as Vice President, Investor Relations, External Relations and Sustainability since September 2020. From November 2016 to September 2020, Mr. Eichmann served as Vice President, Investor Relations and Corporate Communications. From November 2015 to November 2016, Mr. Eichmann served as Vice President, Investor Relations. Prior to that time, and for more than five years, Mr. Eichmann served in various roles, including director, investor relations, at Newmont Mining Corporation, the world's leading gold company and a producer of copper, silver, zinc and lead. Mr. Eichmann has been appointed by the Board as an executive officer effective March 1, 2022, and will serve as Vice President, Chief Marketing and Sustainability Officer.
David C. Lloyd has served as Vice President, and Corporate Financial Controller since joining the Company in April 2014, and in that capacity, Mr. Lloyd is the Chief Accounting Officer of the Company. In March 2016, DavidMr. Lloyd also assumed the role of Treasurer. Prior to that time, and for more than five years, he was a partner within the accounting firm of PricewaterhouseCoopers LLP, a certified public accounting firm.LLP.
Stock Holdings of Certain Owners and Management
The following table sets forth the number of shares of each class of Greif securities beneficially owned, as of the close of business on December 31, 2018,2021, by (i) each person known to the Company to be the beneficial owner of more than 5 percent of our Class B Common Stock, our only class of voting securities, (ii) each of the nomineesdirector and nominee for director, (iii) the executive officers listed in the Summary Compensation Table (the “Named"Named Executive OfficersOfficers" or NEOs”"NEOs”), and (iv) all director nominees, NEOs,directors, NEOs, and other executive officers as a group.
| Name | Title of Class | Shares Beneficially Owned (1) | Percent of Class(2) | |||||||||||
Patricia M. Dempsey 12781 NE 72nd Boulevard, Lady Lake, FL 32162 | Class B | 3,050,502 | (3)(4) | 13.86% | ||||||||||
Shannon J. Diener 200 Civic Center Drive, Suite 1200 Columbus, OH 43215 | Class B | 3,208,886 | (3)(5) | 14.58% | ||||||||||
Mary T. McAlpin 200 Civic Center Drive, Suite 1200 Columbus, OH 43215 | Class B | 3,270,676 | (3)(6) | 14.86% | ||||||||||
Virginia D. Ragan 200 Civic Center Drive, Suite 1200 Columbus, OH 43215 | Class B | 3,578,310 | (3)(7) | 16.26% | ||||||||||
Article 4(c) Trust c/o Shannon Diener 200 Civic Center Drive, Suite 1200 Columbus, OH 43215 | Class B | 2,127,026 | (3)(8) | 9.66% | ||||||||||
Nicholas J. Petitti 200 Civic Center Drive, Suite 1200 Columbus, OH 43215 | Class B | 2,982,210 | (3)(9) | 13.55% | ||||||||||
JDH 2021 Trust c/o Nicholas J. Petitti 200 Civic Center Drive, Suite 1200 Columbus, OH 43215 | Class B | 2,317,451 | (3)(10) | 10.53% | ||||||||||
| Vicki L. Avril-Groves | Class A | 40,177 | (11) | * | ||||||||||
| Michael Cronin | Class A | 34,345 | (12) | * | ||||||||||
| Bruce A. Edwards | Class A Class B | 47,177 2,000 | (11) | * | ||||||||||
| Mark A. Emkes | Class A | 37,857 | (11) | * | ||||||||||
| John F. Finn | Class A | 35,667 | (11) | * | ||||||||||
| Michael J. Gasser | Class A Class B | 182,775 23,796 | (11) | * * | ||||||||||
| Daniel J. Gunsett | Class A Class B | 34,638 4,000 | (11) | * * | ||||||||||
| Lawrence A. Hilsheimer | Class A Class B | 83,773 87,914 | (12) | * * | ||||||||||
| Gary R. Martz | Class A Class B | 67,993 8,100 | (12) | * | ||||||||||
| John W. McNamara | Class A Class B | 30,638 440,603 | (11) (13) | * 2.00% | ||||||||||
| Robert M. Patterson | Class A | 19,760 | (11) | * | ||||||||||
| Ole G. Rosgaard | Class A | 42,956 | (12) | * | ||||||||||
| Kimberly Scott | — | — | ||||||||||||
| Peter G. Watson | Class A Class B | 228,650 4,400 | (12) | * * | ||||||||||
| All directors and executive officers as a group (22 persons) | Class A Class B | 980,718 572,033 | (11)(12) | 3.68% 2.59% | ||||||||||
(1) A person is considered to beneficially own any shares: (a) over which the person exercises sole or shared voting or investment power, or (b) of which the person has the right to acquire beneficial ownership at any time within 60 days of December 31, 2021 (such as through conversion of securities or exercise of stock options). Unless otherwise indicated, voting and investment power relating to the above shares is exercised solely by the beneficial owner (and their spouses, if applicable).
(2) * indicates less than 1 percent.
Greif - Proxy Statement 20
| Name | Title of Class | Shares Beneficially Owned (1) | Percent of Class(2) | ||
Patricia M. Dempsey 12781 NE 72nd Boulevard, Lady Lake, FL 32162 | Class B | 3,050,502 | (3)(4) | 13.86% | |
Shannon J. Diener 200 Civic Center Drive, Suite 1200 Columbus, OH 43215 | Class B | 3,219,075 | (3)(5) | 14.62% | |
Mary T. McAlpin 200 Civic Center Drive, Suite 1200 Columbus, OH 43215 | Class B | 3,208,886 | (3)(6) | 14.58% | |
Virginia D. Ragan 200 Civic Center Drive, Suite 1200 Columbus, OH 43215 | Class B | 3,567,962 | (3)(7) | 16.21% | |
Article 4(c) Trust c/o Shannon Diener 200 Civic Center Drive, Suite 1200 Columbus, OH 43215 | Class B | 2,127,026 | (3)(8) | 9.66% | |
| Vicki L. Avril | Class A | 30,709 | (9) | * | |
| Michael Cronin | Class A | 3,721 | * | ||
| Bruce A. Edwards | Class A Class B | 37,709 2,000 | (9) | * | |
| Mark A. Emkes | Class A | 27,199 | (9) | * | |
| John F. Finn | Class A | 26,199 | (9) | * | |
| Michael J. Gasser | Class A Class B | 173,307 23,796 | (9) | * * | |
| Daniel J. Gunsett | Class A Class B | 25,170 4,000 | (9) | * * | |
| Lawrence A. Hilsheimer | Class A Class B | 70,003 31,861 | * * | ||
Judith D. Hook 200 Civic Center Drive, Suite 1200 Columbus, OH 43215 | Class A Class B | 37,558 2,482,337 | (9)(10) (11) | * 11.27% | |
| Gary R. Martz | Class A Class B | 46,202 1,100 | * | ||
| John W. McNamara | Class A Class B | 21,170 436,362 | (9)(12) (13) | * 1.98% | |
| Ole G. Rosgaard | Class A | 5,415 | * | ||
| Peter G. Watson | Class A Class B | 51,299 4,400 | * * | ||
| All directors and executive officers as a group (19 persons) | Class A Class B | 589,236 2,985,856 | (9) | 2.27% 13.56% | |
(4) All shares held by Ms. Dempsey as trustee under her revocable trust and a family trust.
(5) All shares held by Ms. Diener as custodian or trustee under her revocable trust and family trusts, including the Article 4(c) Trust described in footnote (8).
(6) All shares held by Ms. McAlpin as trustee under her revocable trust and a family trust.
(7) Includes shares held by Ms. Ragan as trustee under her revocable trust and a family trust. Also includes shares held by a charitable foundation (525,140 shares) of which Ms. Ragan is the president. Does not include shares held by John W. McNamara, a director of the Company, who is Ms. Ragan’s son. Ms. Ragan disclaims beneficial ownership of the shares held by Mr. McNamara.
(8) The Article 4(c) Trust held under the Naomi C. Dempsey Declaration of Trust (the “Article 4(c) Trust”).
(9) All shares owned by Mr. Petitti individually or held by Mr. Petitti as trustee under his revocable trust and irrevocable or family trusts. Includes the shares held by Mr. Petitti as trustee of the JDH 2021 Trust described in footnote (10). Also includes 60,000 shares that have been pledged as security for a loan.
(10) The 2021 Amended and Restated Revocable (now Irrevocable) Trust created by Judith D. Hook (the "JDH 2021 Trust").
(11) This table includes restricted shares of Class A Common Stock that have been awarded to directors under our 2005 Outside Directors Equity Award Plan, including shares the receipt of which has been deferred at the director’s election under the terms of the Directors Deferred Compensation Plan. If deferral is elected, shares are issued to the trustee of a rabbi trust established in connection with the Directors Deferred Compensation Plan. The total number of shares of Class A Common Stock held in the rabbi trust for the benefit of each director as of December 31, 2021, was as follows: Ms. Avril-Groves-16,587 shares; Mr. Edwards-34,471 shares; Mr. Emkes-12,497 shares; Mr. Finn-33,667 shares; Mr. Gasser-11,227 shares; Mr. Gunsett-9,468 shares; Mr. McNamara-23,771 and Mr. Patterson-2,854 shares. See also “Corporate Governance - Director Compensation for Fiscal 2021 - Director Participation in Directors Deferred Compensation Plan.”
(12) This table does not include any restricted stock units or performance stock units that have been awarded to executive officers under our 2020 LTIP, as none of these awards have vested or will vest within 60 days of December 31, 2021. See “- Compensation Discussion and Analysis - Long-Term Incentive Plan" for further information on the 2020 LTIP and awards made thereunder.
(13) All shares (other than 3,000) held by Mr. McNamara as trustee of a family trust and a voting trust or as custodian. Does not include shares held by Virginia D. Ragan, who is Mr. McNamara’s mother. Mr. McNamara disclaims beneficial ownership of all shares of Class B Common Stock held by Ms. Ragan.
| Delinquent Section 16(a) |
Section 16(a) of the Securities Exchange Act of 1934 requires our officers and directors, and persons owning more than 10% of a registered class of our equity securities, to file reports of ownership with the Securities and Exchange Commission. Officers, directors and greater than 10% stockholders are required by the Securities and Exchange Commission’s regulations to furnish the Company with copies of all Section 16(a) forms they file. Based solely on a review of the copies of such forms furnished to the Company, the Company believes that during fiscal 20182020 all Section 16(a) filing requirements applicable to its officers, directors and greater than 10% stockholders were complied with by such persons, except as follows: (a) Ms. Raganfollows: Messrs. Bergwall and Mr. McNamaraMartz each failed to timely report one transaction involving a private sale of shares of Class B Common Stock from Ms. Ragan to a family trust of which Mr. McNamara is the sole trustee; (b) Ms. McAlpin failed to timely report one transaction involving the distribution of shares of Class B Common Stock to her from her charitable lead annuity trust; and (c) Ms. Diener failed to timely report one transaction involving a gift of shares of Class B Common Stock from her toconducted by an irrevocable family trust of which Ms. Diener is neither a trustee or beneficiary.
independent financial broker/ advisor.
Greif - Proxy Statement 21
COMPENSATION DISCUSSION AND ANALYSIS
| Overview and Introduction | ||
This Compensation Discussion and Analysis (“CD&A”) identifies and describes our compensation philosophy and objectives, summarizes our executive compensation program and discusses and reviews compensation decisions with respect to our Named Executive Officers (“NEOs”)NEOs for fiscal 2018.2021. This CD&A should be read in conjunction with the compensation related tables that immediately follow this section, as well as with our Annual Report on Form 10-K for fiscal 20182021 (“20182021 Form 10-K”). For fiscal 2018,2021, our NEOs were:
| Name | Title | ||||
| Peter G. Watson | President and Chief Executive Officer | ||||
| Lawrence A. Hilsheimer | Executive Vice President, | ||||
| Ole G. Rosgaard | Chief Operating Officer | ||||
| Gary R. Martz | Executive Vice President, General Counsel and Secretary | ||||
| Michael Cronin | Senior Vice President, | ||||
| Summary of Executive Compensation Governance Practices | ||
To achieve the objectives of our executive compensation program and emphasize our “pay-for-performance” philosophy, the Compensation Committee has continued to employ strong governance practices, including:
| We Do | We Don’t Do | ||||
ü Significant portion of executive total compensation “at risk” | û Hedging or short sales by executive officers or directors | ||||
ü Objective and different metrics for annual and long-term | û Repricing of options without stockholder approval | ||||
ü Caps on annual and long-term incentive pay | û Significant perquisites | ||||
ü Stock ownership guidelines and holding requirements | û Tax gross-ups for perquisites | ||||
ü | û Pledging of Greif stock (requires pre-approval) | ||||
ü Incentive compensation targeted at market and "pay for performance" | ûEmployment contracts or change-in-control arrangements | ||||
û Accelerated vesting of equity awards upon retirement | |||||
| Compensation Committee | ||
The Compensation Committee, whose current members are Daniel J. Gunsett-Chairperson, Vicki L. Avril, Mark A. Emkes Judith D. Hook(Chair), Vicki L. Avril-Groves and PatrickDaniel J. Norton,Gunsett, has primary oversight overfor the design and implementation of our executive compensation program. In addition, theThe Compensation Committee has a Special Subcommittee on Incentive Compensation (the “Special Subcommittee”) thatalso administers our annual cash incentive bonus plan (the “Short Term“Short-Term Incentive Plan” or “STIP”) and our long termlong-term incentive plan, which consists of our Amended and Restated Long-Term Incentive Plan initially approved by stockholders at the 2006 annual meeting, as amended (the “Long Term“2006 LTIP”), and our 2020 Long-Term Incentive Plan”Plan approved by our stockholders at the 2020 annual meeting (the "2020 LTIP," together with the 2006 LTIP, the "Long-Term Incentive Plan" or “LTIP”"LTIP"). The current members ofCompensation Committee from time to time delegates to a subcommittee certain responsibilities related to executive compensation. Prior to February 23, 2021, the Special Subcommittee are Patrick J. Norton - Chairperson, Vicki L. Avril, Mark A. EmkesCompensation Committee used a special subcommittee to administer the STIP and Judith D. Hook. All of the members of the Special Subcommittee areLTIP so that those plans were administered by “outside directors” as that term is defined in Section 162(m) of the Internal Revenue Code of 1986, as amended (the “Code”).amended. Since that time the Compensation Committee has itself fulfilled all executive compensation duties. For the sake of convenience, references to the administration of the STIP and the LTIP for periods before February 23, 2021 will be to the Compensation Committee.
The Compensation Committee utilizes an independent outside compensation consultant, Willis Towers Watson, to provide it with peer group data and market information. While Willis Towers Watson also provides other services to the Company.Company, the Compensation Committee has determined that Willis Towers Watson is independent because they do not have a conflict of interest that would prevent them from providing objective advice to the Compensation Committee. In determining whether Willis Towers Watson has a conflict of interest that would influence its advice to the Compensation Committee, the Compensation Committee considered, among other things,matters, the six factors set forth in the applicable SEC regulations issued under the Dodd-Frank Wall Street Reform and Consumer Protection Act of 2010, namely: the other services provided by Willis Towers Watson to the Company; the amount of fees payable by the Company to Willis Towers Watson as a percentage of that firm’s total revenues; the policies and procedures maintained by Willis Towers Watson to prevent or mitigate potential conflicts of interest; any business or personal relationship between any member of Willis Towers Watson’s executive compensation team serving the Company and any member of the Compensation Committee; any stock of the Company owned by any member of Willis Towers Watson’s executive compensation team serving the Company; and any business or personal relationship between any member of Willis Towers Watson’s executive compensation team serving the Company and any
Greif - Proxy Statement 22
executive officer of the Company. The Compensation Committee reviewed information provided by Willis Towers Watson addressing each of these factors. These SEC regulations retain the principle that the Compensation Committee should have the final say in determining the independence and objectivity of its advisors. No single factor was considered by the Compensation Committee as more important than any other factor or automatically disqualified Willis Towers Watson from being objective. After completing its review, the Compensation Committee determined that Willis Towers Watson does not have a conflict of interest that would prevent them from providing objective advice to the Compensation Committee.
| Compensation Philosophy and Objectives | ||
The Compensation Committee’s compensation philosophy and objectives are designed to align our executive compensation with achieving business and financial goals that drive long-term stockholder value. To achieve this “pay for performance” philosophy, the Compensation Committee has the following key objectives:
| Key Objectives of Our "Pay for Performance" Philosophy | •Attract, recruit and hire talented and outcome driven executives on a local, regional or global basis as needed and appropriately incentivize and reward our current executive officers. •Offer short-term and long-term incentive bonus plans that •Emphasize at-risk components of an executive compensation program to motivate and incentivize our executive officers to drive stockholder value and align their interests with the interest of our stockholders. | |||||||||||||
The CompanyCompensation Committee attempts to achieve its policies and philosophies by establishing performance objectives for itsour executive officers and by linking compensation to financial performance goals, which may include, but are not limited to, targets for earnings before interest, tax and depreciation, depletion and amortization, operating profit before special items, operating working capital as a percent of revenue, and total shareholder return on net assets.relative to the Russell 2000 Index. The Compensation Committee further believes that a portion of each executive’s compensation should be linked to our short-term and long-term performance. In that regard, the Company has the STIP, an annual cash incentive bonus plan that links the annual payment of cash bonuses to the achievement of targeted financial performance goals. See “Elements of Our Compensation Program - Short Term Incentive Plan.” The Company also has thegoals and an LTIP that linksto link the long-term payment of bonuses to the achievement of targeted financial performance goals. See “Elements“- Elements of Our Compensation Program - Long Term"Short-Term Incentive Plan" and "Long-Term Incentive Plan.” The 2006 LTIP aligns long-term stockholder value with compensation by providing for a portion of the payouts in restricted shares, asstock, well as cash. The 2020 LTIP further aligns long-term stockholder value with compensation by including a total shareholder return metric and providing for payouts in restricted stock. The LTIP is also intended to facilitate compliance with our stock ownership guidelines. See “Elements“- Elements of Our Compensation Program - Stock Ownership Guidelines” below.
Target Compensation Mix
In determining the award levels for each of the elements in our total compensation program, our philosophy is to "pay for performance."performance". As a result, we place relatively greater emphasis on the variable components of compensation (STIP and LTIP) to align the interests of our executive officers with the interests of our stockholders and motivate them to drive stockholder value. These variable components are balanced with retention incentives provided by base salary and in certain limited cases, restricted stock awards. The 2020 LTIP provides for even stronger retention incentives for our executive officers through the granting of restricted share units at or near the commencement of each performance period that are subject to a vesting period. We look to the experience and judgment of the Compensation Committee to determine what it believes to be the appropriate target compensation mix for each NEO. As shown in the charts below, incentive components at risk accounted for 80%approximately 82% of the CEO's target compensation and approximately 69% of the other NEOs average target compensation in fiscal 2018.2021.
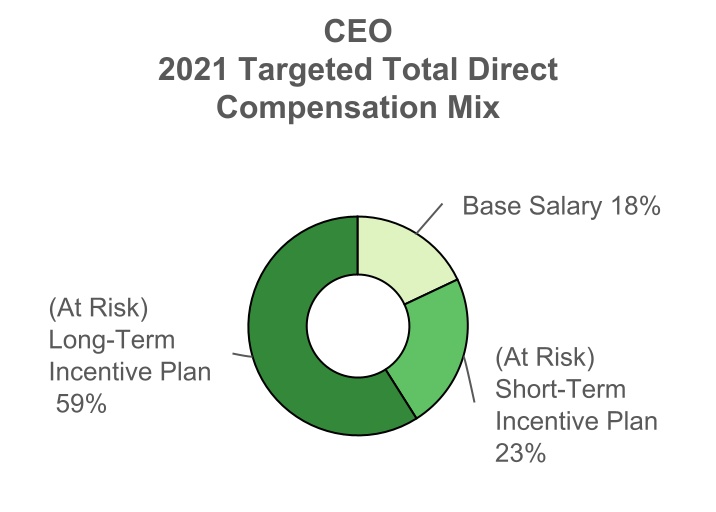
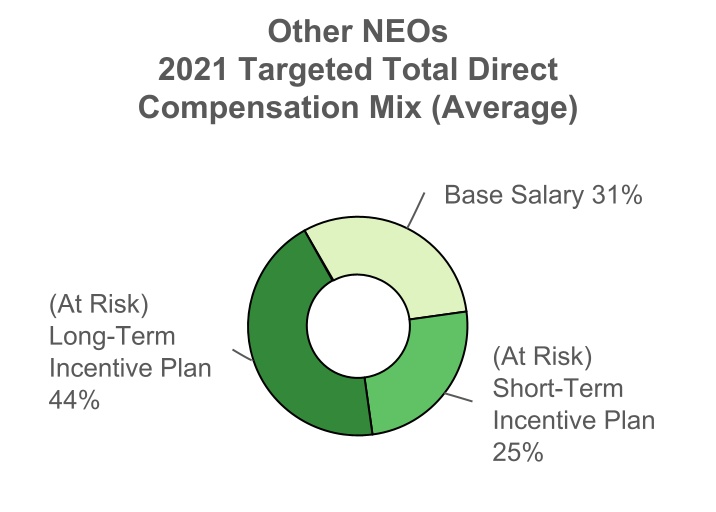
Greif - Proxy Statement 23
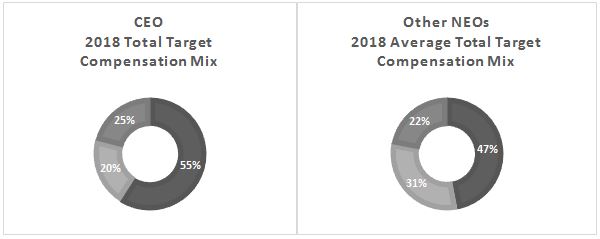
Risk Assessment
During 2018,fiscal 2021, our management ofand the Company,Compensation Committee, with the assistance of Willis Towers Watson, performed an assessment of the risks associated with our incentive plans and determined that the risks associated with such plans are not reasonably likely to cause a material adverse effect onfor the Company.
Peer Group Review
The Compensation Committee, working with Willis Towers Watson, periodically, but at least annually, reviews peer group data and market information for comparable positions in our industry related to our executive officers. The Compensation Committee does not establish targets or benchmarks for executive compensation when assessing peer group data, but rather uses peer group data and other market information to confirm that our compensation targets and awards are comparable and competitive. The information provided by Willis Towers Watson is used by the Compensation Committee and the Special Subcommittee to provide context for their decision making process, but is not used to determine or recommend the amount or form of compensation paid to our executive officers, including our NEOs.
The Compensation Committee, working with its compensation consultant, periodically, but at least annually, also reviews our peer group composition. The selection of peer group companies by the Compensation Committee is based on the nature, composition, geographic scope, complexity and key financial data of potential peer companies in the packaging, paper, manufacturing and industrial businesses. For fiscal 2018, our2021, the Company's peer group remained the same and consisted of the companies listed below. However, due to the consolidation of three companies within our peer group, the Compensation Committee will be reassessing the peer group composition for fiscal 2019.
| Aptargroup, Inc. | ||||||||
| Sealed Air Corporation | ||||||||
| Silgan Holdings, Inc. | ||||||||
| Sonoco Products Company | ||||||||
| Berry Global Group, Inc. | The Timken Company | |||||||
| Celanese Corporation | Owens-Illinois, Inc. | Universal Forest Products Inc. | ||||||
| Valmont Industries, Inc. | ||||||||
| Crown Holdings, Inc. | Patrick Industries, Inc. | |||||||
| Elements of Our Compensation Program | ||
During fiscal 2018, in support of our compensation philosophy and objectives,2021, the key elements of our compensation package were:
The Compensation Committee reviews tally sheets for each NEO prepared by the compensation consultant. The purpose of the tally sheets information is to bring together, in one place, all the elements of compensation for our NEOs to assist the Compensation Committee with making compensation decisions for the next calendar year. These tally sheets typically contain the following information: current base salary; STIP payments for the preceding two fiscal years, and the anticipated payment for the fiscal year just ended; LTIP payments for the preceding two fiscal years, and the anticipated payment to be made for the three-year period just ended; the current value of the SERPapplicable supplemental executive retirement or the DC SERP, as applicable;supplemental deferred compensation plans; and the value of our perquisites (discussed below).perquisites. See "- Retirement and Deferred Compensation Plans - Supplemental Executive Retirement Plans” for a description of these plans.
The Compensation Committee’s final compensation determination regarding one element of compensation is independent of all other elements of compensation and does not affect decisions regarding those other elements of compensation, other than to the extent that awards under the STIP and the LTIP are calculated by using a percentage of base salary.
| Base Salary | ||
Base salaries are primarily designed to provide competitive levels of compensation that attractsattract and retainsretain our executive officers. When determining base salaries for each NEO, the Compensation Committee considers their qualifications, experience, the scope of responsibilities, individual performance and contributions towards our success. Base salaries, which become effective the first pay period of the calendar year, are reviewed annually and are individually determined and may range broadly among our executive officers. The Compensation Committee does not target specific market data for base salaries, but rather compares the compensation levels of other executive officers with equivalent responsibility within our peer group companies and competitive market data to confirm that our base salaries are competitive withwithin the market as well as toand with the compensation levels of other executive officers within the Company for internal fairness purposes.
Greif - Proxy Statement 24
In December 2018,2021, the Compensation Committee approved the following base salaries for the NEOs for calendar year 2019.2022. See above “- 2018“2021 Performance Reviews of CEO and Other NEOs” below for a discussion of the factors considered by the Compensation Committee in its decision to increase the 20192022 base salaries, and the amount thereof, for each NEO.
| NEOs | 2021 Base Salary | 2022 Base Salary | Percentage Change | ||||||||
Mr. Watson (1) | $1,090,000 | $1,090,000 | —% | ||||||||
| Mr. Hilsheimer | $754,466 | $785,399 | 4.1% | ||||||||
Mr. Rosgaard (2) | $594,000 | $650,000 | —% | ||||||||
| Mr. Martz | $630,078 | $655,911 | 4.1% | ||||||||
Mr. Cronin (3) | $608,160 | $600,944 | —% | ||||||||
| NEOs | 2018 Base Salary | 2019 Base Salary | Percentage Change |
| Mr. Watson | $1,030,000 | $1,060,000 | 2.9% |
| Mr. Hilsheimer | $701,988 | $720,239 | 2.6% |
| Mr. Martz | $586,251 | $601,494 | 2.6% |
Mr. Cronin (1) | $538,125 | $565,479 | 2.6% |
| Mr. Rosgaard | $466,866 | $506,550 | 8.5% |
(2)Mr. Rosgaard's base salary was increased to $650,000, effective July 1, 2021, as a result of his promotion to Chief Operating Officer. Mr. Rosgaard will become CEO effective February 1, 2022. This 2022 base salary amount reflects Mr. Rosgaard's base salary from January 1, 2022 through January 31, 2022. Effective February 1, 2022, Mr. Rosgaard will become CEO of the Company with a new base salary of $900,000 (a percentage change of 38.5%).
(3)Mr. Cronin’s base salary is paid in Euros and has been converted to U.S. Dollars using an exchange rate of 1.1745 and 1.160564 for calendar years 2021 and 2022, respectively.
| Short-Term Incentive Plan | ||
The STIP is designed to motivate executive officers and reward achievement of specific and objective performance goals that are linked to the profitability of the Company. For fiscal 2018, compensation paid under the STIP is not intended to be subject to the deduction limitation rules prescribed under Section 162(m) of the Code. See “- Tax Considerations Affecting Compensation Decisions” below.
In administering the STIP, the Special Subcommittee administersCompensation Committee establishes performance goals, target amounts, and award opportunities at the beginning of each performance period for each executive officer selected to participate by the Special Subcommittee,Compensation Committee, including our NEOs. The target award is based on a percentage of the executive officer’s base salary (exclusive of any bonus and other benefits) and is payable in cash upon the achievement of the threshold performance level and capped by the maximum performance level. Under the STIP, each NEO can be awarded anywhere from 0% to a maximum of 200% of his or herthe NEO's respective target incentive award, with 100% as payout for achieving the target performance level. After the end of the performance period, the Special SubcommitteeCompensation Committee certifies the extent to which the performance goals have been achieved and determines the amount of the award that is payable.
No incentive bonus is paid with respect to an applicable metric if the RONAperformance calculation for that metric is below the threshold established for that specific performance period. No additional incentive bonus is paid beyond the established applicable maximum RONAmetric calculation with respect to each applicable metric for each performance period. The Compensation committee establishes the threshold number as being realistic and the maximum as being aggressive for each performance period. Under the STIP, the maximum payment that could be paid to any participant during any twelve-month period is $3.0 million. The Special Subcommittee establishes
For fiscal 2021 and 2020, the threshold number as being realistic and the maximum as being aggressive for each performance period.
Fiscal 2018 STIP Performance Metric | Threshold (50% Payout) | Target (100% Payout) | Maximum (200% Payout) | Actual Performance | Actual % Payout |
100% Corporate RONA(1) | 15.56 % | 16.94% | 18.31% | 18.05% | 181.33% (1) |
In December 2020, the Company.Compensation Committee established performance goals for the fiscal 2021 STIP. The table below summarizes these fiscal 2021 STIP performance goals. For fiscal 2021, OPBSI of $530.4 million and OWC of 10.5% were achieved resulting in an aggregate payout to the NEOs of 200% of the target award.
Fiscal 2021 STIP Performance Metrics | Threshold (50% Payout) | Target (100% Payout) | Maximum (200% Payout) | Actual Performance | Actual Percentage Payout (1) | ||||||||||||
| 80% OPBSI | $359.0 million | $428.6 million | $497.1 million | $530.4 million | 200% | ||||||||||||
| 20% OWC | 12.4% | 11.8% | 11.1% | 10.5% | 200% | ||||||||||||
(1) Prorated for performance between payout levels.
The table below summarizes the fiscal 20192022 STIP performance goals established by the Special SubcommitteeCompensation Committee in December 20182021 based on its evaluation of our business plan and prospects for the next fiscal year. For fiscal 2022, the Committee will continue to use the same STIP performance goal metrics used in fiscal 2020 and 2021.
Greif - Proxy Statement 25
Fiscal 2019 STIP Performance Metrics | Threshold (50% Payout) | Target (100% Payout) | Maximum (200% Payout) |
| 80% OPBSI | 383.6 | 417.0 | 450.4 |
| 20% MSFCF | 468.5 | 501.9 | 535.3 |
Fiscal 2022 STIP Performance Metrics | Threshold (50% Payout) | Target (100% Payout) | Maximum (200% Payout) | ||||||||
| 80% OPBSI | $484.1 million | $576.4 million | $668.6 million | ||||||||
| 20% OWC | 11.6% | 11.0% | 10.4% | ||||||||
Each year, the Special SubcommitteeCompensation Committee reviews the STIP target awards for each NEO based on its judgment of the impact of the position in the Company and what it believes to be competitive against market data while considering internal pay equity for comparable positions. The fiscal 20192021 target awardsaward opportunities were, and the 2022 target award opportunity for each NEO, are as follows:
| Fiscal 2021 STIP Target Award Opportunity | Fiscal 2022 STIP Target Award Opportunity | |||||||||||||
| NEOs | (% of Base Salary) | ($) | (% of Base Salary) | ($) | ||||||||||
Mr. Watson (1) | 125% | $1,362,500 | 125% | $1,362,500 | ||||||||||
| Mr. Hilsheimer | 95% | $716,743 | 95% | $746,129 | ||||||||||
Mr. Rosgaard (2) | 80% | $475,200 | 80% | $520,000 | ||||||||||
| Mr. Martz | 80% | $504,062 | 80% | $524,729 | ||||||||||
Mr. Cronin (3) | 65% | $395,304 | 65% | $390,614 | ||||||||||
| Fiscal 2018 STIP Target Award | Fiscal 2019 STIP Target Award | |||
| NEOs | (% of Base Salary) | ($) | (% of Base Salary) | ($) |
| Mr. Watson | 125% | $1,287,500 | 125% | $1,325,000 |
| Mr. Hilsheimer | 85% | $596,690 | 90% | $648,215 |
| Mr. Martz | 70% | $410,376 | 75% | $451,121 |
Mr. Cronin (1) | 65% | $349,781 | 65% | $367,561 |
| Mr. Rosgaard | 65% | $303,463 | 70% | $354,585 |
(2)Mr. Rosgaard's target award opportunity amount was increased to $520,000 as a result of his promotion to Chief Operating Officer. Mr. Rosgaard's fiscal 2022 target award opportunity represents his target from November 1, 2020 through January 31, 2022. Effective February 1, 2022, Mr. Rosgaard will become CEO of the Company and his 2022 award opportunity will become $900,000, 100% of his base salary.
(3)Mr. Cronin's compensation is paid in Euros and has been converted to U.S. Dollars using an exchange rate of 1.1745 and 1.160564 for fiscal 2021 and 2022, respectively.
| Long-Term Incentive Plan | ||
The LTIP is intended to focus our executive officers on the key measures that drive superior performance over the longer-term. The Compensation paid underCommittee administers the LTIP is not intended to be subject to the deduction limitation rules prescribed under Section 162(m) of the Code. See “- Tax Considerations Affecting Compensation Decisions” below. The Special Subcommittee administers the LTIP. Employees who are designated by the Special Subcommittee asand designates "executive officers" and “key employees” are eligible to participate in and receive awards under the LTIP. Prior to the beginning of aFor each three-year performance period, which period commences on the first day of the first fiscal year for that performance period, the Special SubcommitteeCompensation Committee selects the award opportunity for all executive officers and key employees, including each of our NEOs. The incentive compensationLTIP award opportunity is based on the Special Subcommittee’sCompensation Committee’s reasoned business judgment and subjective review of, based in part on the recommendation of theour CEO, the key employee’s scope of responsibility and historical performance. The
In December 2018, the Compensation Committee established the following LTIP target award opportunity for each NEO for the three-year period performance period that endedfiscal 2021.
| LTIP Target Award Opportunity for 2019-2021 Performance Period | ||||||||
| NEOs | (% of Average Base Salary) | ($) | ||||||
| Mr. Watson | 350% | $3,739,167 | ||||||
| Mr. Hilsheimer | 210% | $1,542,475 | ||||||
| Mr. Rosgaard | 135% | $754,997 | ||||||
| Mr. Martz | 170% | $1,042,803 | ||||||
Mr. Cronin (1) | 125% | $725,264 | ||||||
(1)Mr. Cronin’s compensation is paid in fiscal 2018 was:Euros and has been converted to U.S. Dollars using an exchange rate of 1.148446.
| LTIP Target Award for 2016-2018 Performance Period | ||
| Named Executive Officer | (% of Average Base Salary) | ($) |
| Mr. Watson | 300% | $2,910,101 |
| Mr. Hilsheimer | 200% | $1,367,462 |
| Mr. Martz | 160% | $915,330 |
Mr. Cronin (1) | 125% | $671,345 |
| Mr. Rosgaard | 115% | $481,195 |
For the three-year performance periodsperiod ending in fiscal 2016, 2017 and 2018,2021, the performance goals weregoal was based on targeted levels of adjusted earnings before interest, taxes, depreciation, depletion and amortization (“EBITDA”), subject to such adjustments that the Special SubcommitteeCompensation Committee determines to be necessary to reflect accurately the EBITDA of the Company for the applicable period. This measure was chosen because the Special Subcommittee believesCompensation Committee believed that it iswas the financial measure most aligned with current analyses for maximizing stockholder value.
For each three-yearthis performance period, award,awards to participants are to be paid under the 2006 LTIP. Therefore, the awards are to be paid 50% in cash and 50% in restricted shares of our Class A and/or Class B Common Stock, as determined by the Special Subcommittee,Compensation Committee, with the number of restricted shares awarded being based on the average closing price of such restricted shares during the 90 day90-day period preceding the day that the performance criteria for the applicable three-year2019-2021 performance period was established. The Special Subcommittee believesCompensation Committee determined at that time, that awarding restricted shares in lieu of cash better aligns the interests of the NEOs and other key employees with the interests of our stockholders and facilitates compliance with the stock ownership guidelines by participants. See “Stock“- Stock Ownership Guidelines” below. All restricted stock issued pursuant to the 2006 LTIP is fully vested on the date of issuance, with a restriction on the sale or transfer of the restricted shares within a prescribed time period determined
by the Special SubcommitteeCompensation Committee (typically one year and one day from the date of issuance) that is not impacted in any way upon a change in control of the Company. This is the last year awards will be paid under the 2006 LTIP.
Greif - Proxy Statement 26
As a result of the approval by stockholders of the 2020 LTIP, for each of the three-year performance periods ending in fiscal 2022, 2023 and 2024, the Compensation Committee modified the construct of the Company's long-term incentives in order to pay awards solely in restricted shares of our Class A and/or Class B Common Stock, as determined the Compensation Committee, except in select countries where impediments exist related to the issuance of our stock. For each of these performance periods, awards to participants are made under the 2020 LTIP and are based on a target percentage of the NEOs base salary (exclusive of any bonus and other benefits) and paid in a combination of restricted stock units ("RSUs") and performance stock units ("PSUs") in a ratio determined by the Compensation Committee (for the three-year performance periods ending in fiscal 2022 and 2023, the ratio is 30% RSU/ 70% PSU for Mr. Watson and 40% RSU/ 60% PSU for the other NEOs). The number of RSUs and PSUs are determined using the average closing price of the restricted shares during the 30 and 90 day periods preceding the day that the performance criteria for the applicable three-year performance period was approved by the Compensation Committee (for fiscal 2022, 2023, and 2024), respectively. RSUs are issued at or near the commencement of each performance period. The RSUs granted are time-based and vest approximately three-years after they are granted.RSUs possess dividend equivalent rights, however, no dividend-equivalents will be paid until the underlying RSUs have vested. RSUs do not have voting rights until the units are converted into shares. The number of PSUs ultimately awarded will be determined on the achievement of performance goals that will continue to be based on targeted levels of EBITDA, along with a relative total shareholder return ("TSR") modifier range of +/-20% against the Russell 2000 Index during the performance period to further align performance with stockholder value. Unvested RSUs and PSUs are forfeited upon termination of employment, except in the case of death, disability or retirement in which case the RSUs and PSUs will be reduced on a pro rata basis as provided by the 2020 LTIP to reflect participation prior to termination.
The Special Subcommittee may establishCompensation Committee established a range of performance goals that, if achieved, will result in an incentive award payment under the 2006 LTIP or of PSUs only, under the 2020 LTIP, respectively, that starts at the threshold performance level and is capped at the maximum performance level. Under the LTIP, our NEOs can be awarded anywhere from 0% to a maximum of 200% of the target incentive award with 100% asbeing the payout for achieving the target performance level. The Special SubcommitteeFor each three-year performance period, the Compensation Committee establishes the target incentive award for each participantparticipant. Under the 2006 LTIP, the target incentive award is based on a percentage of that participant’s average base salary (exclusiveduring the three-year performance period, and under the 2020 LTIP, the target incentive award is based on the starting base salary at the beginning of any bonus and other benefits) during the three-year performance period. The Special Subcommittee mayCompensation Committee also establishestablishes a threshold level of performance goal, the achievement below which no awards are paid to any participant. For the three-year performance periods ending in fiscal years 2019, 20202021, 2022, 2023 and 2021, the minimum2024, this threshold level of performance goal achievement is 33% of the target award.
The Special Subcommittee establishedfollowing table summarizes the principal design elements for the 2019-2021 performance period and the three-year overlapping performance periods currently in cycle.
| LTIP Performance Period | 2019-2021 | 2020-2022 | 2021-2023 | 2022-2024 | |||||||||||||
| Plan Document | 2006 LTIP | 2020 LTIP | |||||||||||||||
| Performance Metrics | EBITDA | EBITDA with a TSR Modifier (+/-20%) | |||||||||||||||
| Award Opportunity | 50% Cash | CEO: 30% RSUs / 70% PSUs Other NEOs: 40% RSUs / 60% PSUs | |||||||||||||||
| 50% Restricted Stock | |||||||||||||||||
| Determination of Payout* | Payout award at end of performance period based upon the percentage of performance metrics achieved | RSUs = three-year vesting requirement | |||||||||||||||
| PSUs = awarded based upon the percentage of performance metrics achieved | |||||||||||||||||
(*) If the NEO is not employed by the Company on the vesting date, the awards are forfeited except in the case of death, disability or retirement in which case the RSUs and PSUs will be reduced on a pro rata basis as provided in the 2020 LTIP.
The Compensation Committee establishes a threshold number as beingthat is realistic to achieve and set thesets a maximum threshold number as beingthat is difficult to achieve for the applicable performance period. After the performance goals are established, the Special SubcommitteeCompensation Committee aligns the achievement of the performance goals with the award opportunities, such that the level of achievement of the pre-established performance goals at the end of the performance period determines the “final awards” (i.e., the actual incentive compensation earned during the performance period by the participant). In the event of a material acquisition, the Special Subcommittee may consider, within the parameters of the law and the plan document, adjustments to the performance goals.
For fiscal 2018,2021, NEOs were eligible to receive a 2006 LTIP award payoutspayout based on performance targets set in December 20152018 covering the fiscal 2016-20182019-2021 LTIP performance period. In December 2018,2021, the Special SubcommitteeCompensation Committee reviewed the Company's EBITDA for the 2019-2021 performance period and determined that the 33% threshold level of the target award was not achieved for this performance period.However, the Compensation Committee noted that the Company had achieved targeted performance levels of EBITDA for the 2019 and 2021 fiscal years and that it was solely the 2020 fiscal year, during which time the COVID-19 pandemic started, which caused the Company not to achieve the threshold level of the target award. The Compensation Committee recognized the pandemic as an extremely rare and extraordinary event that broadly and negatively impacted businesses and economies on a global scale. The Compensation Committee acknowledged that management took prompt, decisive action that enabled the Company to operate through the initial phases of the pandemic which occurred during the 2020 fiscal year. If not for these actions, the Compensation Committee concluded that the adverse impact of COVID-19 on the Company's stakeholders would have been much worse. Accordingly, the Compensation Committee, after considering the factors described above, used its discretion and determined
Greif - Proxy Statement 27
that a payout of 168.09%40% was earned based on the adjusted EBITDA for the 2019-2021 performance period as shown in the table below, while noting that since fiscal 2015 management had overseen EBITDA improvement of nearly 48% ($325 million in fiscal 2015 to $480.7 million in fiscal 2018).below. See “Executive Compensation - Summary Compensation Table” for the amount of the award to the Named Executive OfficersNEOs under the LTIP for fiscal 2018.2021.
Threshold (33% Payout) | Target (100% Payout) | Maximum (200% Payout) | Actual Performance | Actual % Payout(1) | |||||||||||||
| 100% EBITDA | $ | $ | $ | $ | |||||||||||||
(1)Prorated for performance between payout levels.
In December 2021, the Compensation Committee established performance goals and award levels for the 2022-2024 performance period commencing November 1, 2021 and ending October 31, 2024. The table below sets forth the number of RSUs granted to each NEO by the Compensation Committee (subject to vesting requirements).
| NEOs | Number of RSUs | |||||||
| Mr. Watson | 9,909 | |||||||
| Mr. Hilsheimer | 10,941 | |||||||
| Mr. Rosgaard | 15,332 | |||||||
| Mr. Martz | 7,350 | |||||||
Mr. Cronin (1) | 4,438 | |||||||
2022-2024 LTIP Performance Goals - Confidentiality - OurThe EBITDA performance goals used inestablished by the LTIPCompensation Committee for each of the three-year periods ending in fiscal years 2019, 2020year 2022, 2023 and 2021,2024, are not included in this CD&A section because the we believe that disclosure of this information would cause us substantial competitive harm. In the rigidglobal industrial packaging and the flexible products segmentssegment of our business, which accounts for over three-quartersapproximately sixty percent of our revenues, our competitors are mostly privately-held companies that generally do not disclose their financial information, executive salaries and other key information to the public, and thus our detailed disclosure of targeted EBITDA would give a competitive advantage to our competitors. Although we provide earnings guidance to investors, we attempt to incentivize our executive officers and key employees at levels above and below this guidance at a higher or lower percentage of their annual base salaries and the public disclosure of such levels could create confusion with investors. In addition, the public disclosure of the prospective targets and ranges ofour EBITDA metrics under the LTIP would cause substantial competitive harm because, among other matters, we would be disclosing to our competitors the long-term bonus structure of our NEOs and other key employees and would be providing our competitors with our anticipated level of earnings for the next three years, which could provide significant insight into our corporate initiatives and activities, including merger and acquisition activities and other growth plans.
For purposes of illustration and to provide context to our stockholders regarding the difficulty our NEOs face in achieving the performance targets under the LTIP, the percent of the target goal achieved for each performance target for each of the three-year periods ending in the last threeeight fiscal years is set forth below:
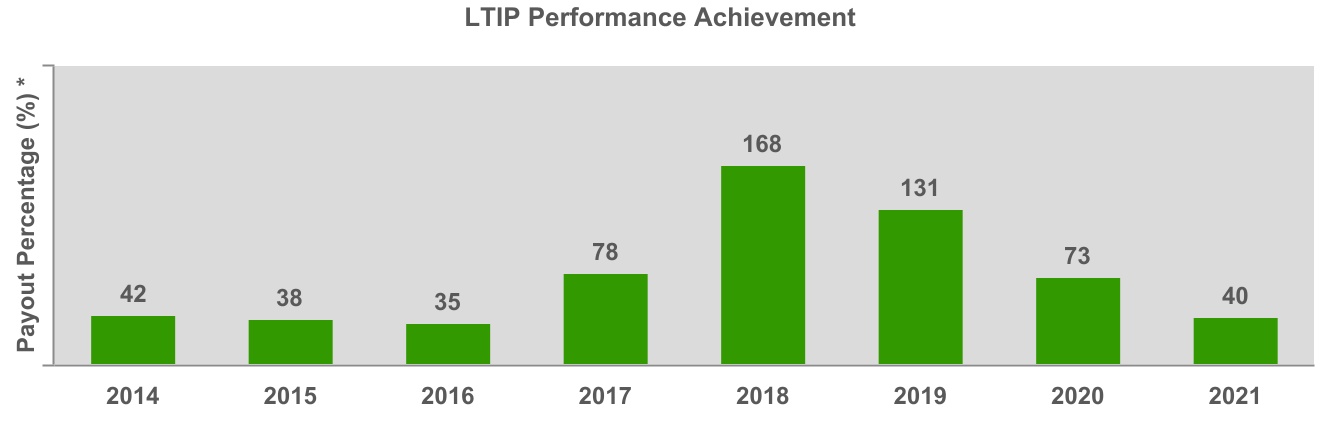
* Under the LTIP the target payout is 100% (threshold = 33% and maximum = 200%)
| 3-Year Performance Period Ending Fiscal Year | EBITDA | |
| Actual Performance Achieved (%) | Maximum Performance Achievable (%) | |
| 2018 | 168 | 200 |
| 2017 | 78 | 200 |
| 2016 | 35 | 200 |
Greif - Proxy Statement 28
| Stock Ownership Guidelines | ||
The Board of Directors has adopted stock ownership guidelines to better align the interests of our executive officers and key employees with the interests of our stockholders. In furtherance of our commitment to sound corporate governance, our executive officers and key employees are required to hold shares of Company stock valued at the following multiple of their annual base salary:
| Position | Ownership Level | ||||
| CEO | 5X Base Salary | ||||
| Executive Officers (other than CEO) | 3X Base Salary | ||||
| Key Employees | 1X Base Salary | ||||
Our executive officers and key employees have five years after initial participation in the LTIP, or the attainment of a position that requires a higher threshold, as the case may be, to meet these stock ownership guidelines. Our executive officers and key employees are generally required to retain 100% of the shares of their restricted stock awards under the LTIP (all of which shares are fully vested upon issuance) until they have satisfied the stock ownership threshold associated with their position. Once in compliance with the stock ownership guidelines associated with their position, executive officers and key employees will remain in compliance with these guidelines regardless of decreases in the trading price of our shares, changes to their base salary or immaterial dispositions of shares, until attainment of a position requiring a higher threshold, in which case the five-year compliance period starts again.
The Compensation Committee annually reviews compliance by our executive officers and key employees with these stock ownership guidelines. The Compensation Committee has determined that each NEO is in compliance with the stock ownership guidelines or within the five-year compliance period associated with their position. Failure to satisfy the requirements of the guidelines may impact participation by an executive officer or key employee in the LTIP in future years, among other matters.
| Retirement and Deferred Compensation Plans | ||
The Company offers a number of retirement and deferred compensation plans. Due to the varying tenure of our NEOs and the transition of certain of our retirement plans, our NEOs participate in different program based on geographic location and hire date. The table below indicates the retirement benefits applicable to each NEO in fiscal 2021.
| Defined Benefits | Defined Contribution | |||||||||||||||||||
| Qualified | Nonqualified | Qualified | Nonqualified | |||||||||||||||||
| Name | Pension Plan | SERP | 401(k) | DC SERP | NQSP | NQDCP | ||||||||||||||
| Mr. Watson | ü | ü | ü | |||||||||||||||||
| Mr. Hilsheimer | ü* | ü | ||||||||||||||||||
| Mr. Rosgaard | ü* | ü | ü | |||||||||||||||||
| Mr. Martz | ü | ü | ü | |||||||||||||||||
| Mr. Cronin | ü** | |||||||||||||||||||
* Participant receives a retirement benefit contribution into their 401(k) account equal to 3% of participant's eligible compensation subject to IRS limitations since participant is not eligible to participate in the U.S. Pension Plan. See footnote 5 to the Summary Compensation table for further details.
** Participant participates in pension plans sponsored by a subsidiary of the Company in the Netherlands.
Pension Plans
Mr. Cronin participates in a pension planplans sponsored by a subsidiary of the Company in the Netherlands. This pension plan provides benefits to Mr. Cronin upon his reaching the normal retirement age under the plans, whichNetherlands, and he is 67. Mr. Cronin is currentlyfully vested in thehis benefits under these pension plan. Mr. Cronin’splans. See "Executive Compensation Tables - Pension Benefits - Pension Plans" for additional information regarding our pension plan does not offer early retirement benefits.plans.
Supplemental Executive Retirement Plans
Greif - Proxy Statement 29
installments quarterly over 15 years. Messrs. Watson and Martz are the only NEOs eligible to participate in the SERP, and both are fully vested in their benefits under the SERP. See "Executive Compensation Tables - Pension Benefits - Supplemental Executive Retirement Plans" for additional information regarding our SERP.
Executive officers, including our NEOs who are not eligible to participate in the Pension Planpension plan may participate in the Defined Contribution Supplemental Executive Retirement Plan (“DC SERP”). Under the DC SERP, we accrue an amount equal to a specified percentage of the executive officer’s annual compensation. “Compensation” for purposes of the DC SERP includes base salary and payments under the STIP. This account is also credited annually with interest based on the discount rate used under the Pension Plan.U.S pension plan. Vesting under the DC SERP requires 10 years of service or the attainment of age 65 with at least five years of service.65. Vested executive officers are entitled to the payment of a future benefit upon retirement equal to the accrued amounts and credited interest, which is payable in equal installments quarterly over 15 years. As of the date of this Proxy Statement, Mr. Hilsheimer is the only NEO currently participating in the DC SERP, but he is not vested in his benefits under the DC SERP.
Defined Contribution/401(k) Plan
We maintain a tax-qualified defined contribution plan meetingthat is intended to meet the requirements of Section 401(k) of the Code, commonly called a 401(k) plan. The 401(k) plan is available on the same terms to substantially all of our U.S. employees, including our U.S. basedU.S.-based NEOs. Each participant can elect to contribute from 0% to 100% of his or her base salaryeligible earnings to the 401(k) plan, subject to Internal Revenue Service (“IRS”)
and ERISA limitations. The deferred amount is invested in accordance with the election of the participant in a variety of investment choices, including a Company stock fund. Subject to certain limitations, we have the option to match a participant’s contributions to the 401(k) plan. The Company doesplan, and we currently do match a percentage of a participant's 401(k) employee contributions andcontributions. U.S. employees not eligible to participate in the Pension PlanU.S. pension plan are entitled to an additional employer contribution. This additional employera company retirement contribution only appliesof 3% of the employee's eligible earnings subject to Messrs. Hilsheimer and Rosgaard. While aIRS limitations. A participant is alwaysfully vested in his or her own salary reduction contributions, but the right of a participant to amounts credited to his or her account as company-matchingcompany contributions is subject to vesting as provided by the 401(k) plan. All NEOs other than Mr. Cronin receive company-matching contributions. The only NEOs currently receiving company retirement contributions are Messrs. Hilsheimer and Rosgaard.
Nonqualified Supplemental Deferred Compensation Plan
We have a nonqualified supplemental deferred compensation plan ("NQSP") for certain executive officers who do not participate in the SERP or DC SERP described above. This plan credits eligible officers who are employed on December 31 of each calendar year with a contribution equal to the maximum employer contribution rate under the Company's 401(k) Plan, multiplied by the excess, if any, of the sum of the officer's base salary and annual short-term incentive plan bonus payments, over the maximum compensation limit under Code Section 401(a)(17) for the applicable year. This plan also permits discretionary Company contributions, which may vary by eligible officer. The Company does not presently intend to make any discretionary contributions. The plan is compliant with the regulations promulgated by the IRS under Code Section 409A. We distribute the vested deferred balance upon retirement, termination from employment, death or disability based on a schedule selected by the officer. Mr. Rosgaard is the only NEO currently participating in the NQSP.
Nonqualified Deferred Compensation Plan
We have a nonqualified deferred compensation planNonqualified Deferred Compensation Plan ("NQDCP") for our executive officers, including our NEOs, which provides a vehicle for our executive officers to elect to defer amounts higher than the IRS limits established for qualified plans.their compensation. This plan is compliant withintended to meet the regulations promulgated by the IRS underrequirements of Section 409A of the Code. The CompanyMr. Rosgaard is the only NEO that has never matched any deferredelected and is currently deferring compensation or provide other discretionary contributions. Base salary, STIP and LTIP payments are all eligible for deferral intounder this plan. There are no limits on the amounts of compensation eligibleSee “Executive Compensation Tables - Pension Benefits - Nonqualified Deferred Compensation - Nonqualified Deferred Compensation Plan” for deferral. For example, an executive officer may defer 100% of his or her compensation. The deferred compensation (and Company match or contributions, if any) are deposited into a rabbi trust to protect and segregate the funds. Deferred funds are invested in the same range of investment options as are available inadditional information regarding our 401(k) plan discussed above. We distribute the deferred balance upon retirement, termination from employment, death or disability based on a schedule selected by the executive officer.NQDCP.
| Perquisites | ||
In addition to the compensation described above, we provide a health and wellness program for our executive officers, including our NEOs, which includes annual physical exams. Mr. Hilsheimer also received a one-time tax preparation services fee reimbursement in fiscal 2021 related to the technical 409A violation that occurred in fiscal 2020 with respect to his Nonqualified Deferred Compensation Plan account. We offer no other perquisites to our U.S. basedU.S.-based NEOs. Mr. Cronin, who is based in Europe, is provided in accordance with customary local practice, a pension contribution gap payment, housing allowance and tax preparation services fee reimbursement. See Footnote (5) to the “Summary Compensation Table” for information concerning these perquisites.
| “Say-on-Pay” Advisory Votes | ||
At our 2017 annual meeting of stockholders, the holders of Class B Common Stock approved a three-year frequency period for holding advisory votes on executive compensation toof our NEOs (with a vote in excessNEOs. At our 2020 annual meeting of 55% of shares voted). In addition,stockholders, the holders of Class B Common Stock approved, on an advisory basis, the executive compensation to our NEOs (by an affirmative vote in excess of 99% of shares voted), as disclosed in the CD&A section and compensation tables, as well as the other narrative executive compensation disclosures contained in the definitive2020 proxy statement for our 2017 annual meeting of stockholders, NEOs identified therein. Based on that vote, the Compensation Committee determined that no changes to our executive compensation program were warranted.statement. The next stockholder advisory votesvote on approval of executive compensation and the frequency period of such votes and an advisory vote on executive compensation of our NEOs will be held next year during our 2020 and 2023 annual meetingsmeeting of the stockholders, respectively.stockholders. The Compensation Committee will continue to review the design of our executive compensation program, particularly in light of our “say-on-pay” votes, executive
Greif - Proxy Statement 30
compensation developments and our pay-for-performance philosophy, to align the executive compensation program consistent with the interests our stockholders.
| Recoupment Policy | ||
Our Board has adopted a recoupment policy, or clawback policy, which generally provides for the recoupment by the Company of certain incentive based compensation payments and awards paid to certain current or former officers of the Company. Under this policy, in the event that we are required to prepare an accounting restatement of our financial statements due to a material noncompliance with any financial reporting requirements, the Compensation Committee (as the administrator of the recoupment policy) may require recoupment, repayment and/or forfeiture of all or any portion of any incentive compensation paid that exceeds the amount an officer would have received had the incentive compensation paid or awarded been calculated based on our restated financial statements, as determined by the Compensation Committee in its discretion.
2021 Performance Reviews of CEO and Other NEOs
The Compensation Committee reviews the performance of theour CEO and other NEOs based upon certain pre-established performance categories approved by the Compensation Committee. The performance categories were determined by the Compensation Committee to be aligned with our compensation philosophy and objectives. These categories are as follows:
| 1. Financial Performance Results | ||
| 2. Strategic Effectiveness and Innovation | ||
| 3. Business Management | ||
| 4. Talent Management | ||
| 5. Personal Effectiveness | ||
| 6. Board Relations (CEO only) | ||
In reviewing Mr. Watson’s performance as CEO for fiscal 2018,2021, the Compensation Committee solicited written comments from all members of the Board of Directors based on the above six categories using the following criteria: exceeds expectations; meets expectations; and needs improvement. The Compensation Committee compiled the written comments. In evaluating fiscal 20182021 performance of Mr. Watson with respect to each of the categories of his compensation, the Compensation Committee specifically discussed and recognized the following factors of Mr. Watson’s performance during the year:
•His strong leadership and crisis management skills united the Company in the face of a challenging labor market, disruptive supply chain and transportation environment, as well as his continued intense focus on measurably enhancing customer relations andemployee safety through the COVID-19 pandemic;
•His continued commitment on serving the needs of our customers, employees and suppliers to mitigate the Company’s customersimpact of the supply chain disruption and continuing to supply high quality products and exceptional customer service, which will place the Company in a good position for continued growth;
•His leadership and focus on improving the Company's liquidity and accelerated debt repayment through a number of incremental actions, including the sale of a large holding of timberland and refinancing of the Euro Senior Notes resulting in improved financial performancea cash preservation and higher gross marginsgeneration for the Company; and net income;
•His directed efforts to measurably enhance customer relations, drive towards a world-class safety culture, rationalize the footprint of operations, enhance the personnel succession process, and respond to numerous market challenges in areas of tariffs, tax reform, foreign exchange, transportation costs, regional economic shifts, and competitive pressures;
Our CEO, Mr. Watson, reviews the performance of each NEO (other than himself) annually based on the first five performance categories set forth above using three criteria - exceeds expectations,expectations; meets expectations,expectations; and needs improvement - as well as using other subjective assessments of performance. After completing his performance review, Mr. Watson reports his subjective determinations and recommendations to the Compensation Committee and Special Subcommittee.Committee. No single factor is given specific relative weight by Mr. Watson, or the Compensation Committee, but all of the factors are considered in the aggregate in their collective experience and reasoned business judgment. The Compensation Committee and Special Subcommittee then considerconsiders any proposed adjustments, to the base salary, STIP and LTIP compensation, and award opportunities for those NEOs and determine whether these compensation components are at appropriate levels in light of the salaries and bonuses of other executive officers in equivalent roles in our peer group and market data provided by Willis Towers Watson.
Greif - Proxy Statement 31
Mr. Watson noted the following factors for the performance of each of the NEOs during the prior fiscal year:
•Mr. Hilsheimer- His leadership in driving the Company to meet our 2020 performance objectives, his continuing guidance in the implementation of a global ERP system and the improvement of our internal controls environment, his focus on proactive communication with Company stockholders and the investment community, the successful navigation of the Company’s tax structure and the creation and implementation of a robust risk management process related to capital allocation strategies.
Mr. Rosgaard - His diligent efforts in leading the Global Industrial Packaging business through a challenging and disruptive supply chain market, along with severe cost inflation and a tight labor market; and aligning the Company's global business operations with a "One Greif" approach to drive safety, colleague engagement and excellent customer service to create value for stockholders, and his focus and preparation for his new role as Chief Executive Officer in fiscal 2022.
•Mr. Martz - His continued leadership of the legal department and ability to navigate the continuously changing legal, safety and global compliance obligations resulting from COVID-19 and effectively leading the real estate department in support of the Company's network optimization efforts and successful sale of a large holding of timberlands with the proceeds applied to debt repayment, and his leadership and business acumenguidance in guiding business executiondriving a culture of servant leadership and performance improvementcustomer service.
•Mr. Cronin - His focus and achievement in successfully maintaining continuity of supply within the global sourcing and supply chain function in the North American RIPS businessface of challenging global supply chain disruptions and in the Latin America RIPS business;severe cost inflation, and his continued focus on serving our customers by achieving excellent Customer Service Index scores for the businesses he leads, his continued development of upgrading his team in Latin America, and his guidance, leadership and input into our strategic growth strategy and his efforts to champion our sustainability strategies and progress towards meeting our 2025 global sustainability goals.guidance on developing an enterprise strategy.
Greif - Proxy Statement 32
COMPENSATION COMMITTEE MATTERS
| Compensation Committee Interlocks and Insider Participation | ||
During fiscal 2018,2021, the Compensation Committee members were Daniel J. Gunsett-Chairperson, Vicki L. Avril, Mark A. Emkes (Chair), Vicki L. Avril-Groves, Daniel J, Gunsett and Judith D. Hook and Patrick J. Norton.Hook. During fiscal 2018,2021, the Company retained the law firm of Baker & Hostetler LLP to perform certain legal services on its behalf, and it anticipates retaining such firm in fiscal 2019.2022. Mr. Gunsett iswas a partner of Baker & Hostetler LLP.LLP during the first two months of fiscal 2021, and he retired from the law firm in December 2020. The Board has determined that Mr. Gunsett and the other members of our Compensation Committee met all of the applicable standards of independence for compensation committee members.
No executive officer of the Company served during fiscal 20182021 as a member of a compensation committee or as a director of any entity of which any of the Company’s directors served as an executive officer.
| Compensation Committee Report | ||
The Compensation Committee has reviewed and discussed the CD&A above with Company’sour management and, based on this review and discussion, has recommended to the Board that this CD&A be included in this proxy statement and incorporated by reference into the 20182021 Form 10-K.
Submitted by the Compensation Committee of the Board of Directors.
Vicki L. | ||
Greif - Proxy Statement 33
EXECUTIVE COMPENSATION TABLES
| Summary Compensation Table | ||
The following table sets forth the compensation for the fiscal years ended October 31, 2018, 20172021, 2020 and 20162019 for our principal executive officer, principal financial officer (and those individuals acting in a similar capacity) and three other most highly compensated executive officers, (the “NEOs”our NEOs.
| Name and Principal Position | Year | Salary ($)(1) | Bonus ($) | Stock Awards ($)(2) | Option Awards ($) | Non-Equity Incentive Plan Compensation ($)(3) | Change in Pension Value and Nonqualified Deferred Compensation Earnings ($)(4) | All Other Compensation ($)(5) | Total ($) | ||||||||||||||||||||
Peter G. Watson President and Chief Executive Officer | 2021 | 1,084,231 | 882,736 | 3,472,833 | 2,644,444 | 14,145 | 8,098,389 | ||||||||||||||||||||||
| 2020 | 1,060,000 | — | 1,037,783 | 2,116,727 | 1,293,936 | 14,018 | 5,522,464 | ||||||||||||||||||||||
| 2019 | 1,055,385 | — | 1,842,742 | — | 3,341,348 | 1,721,549 | 13,501 | 10,187,093 | |||||||||||||||||||||
Lawrence A. Hilsheimer Executive Vice President, Chief Financial Officer | 2021 | 750,377 | 364,156 | 1,741,981 | 33,623 | 385,214 | 3,275,351 | ||||||||||||||||||||||
| 2020 | 731,209 | — | 430,499 | — | 949,846 | 9,015 | 611,672 | 2,732,241 | |||||||||||||||||||||
| 2019 | 717,431 | — | 816,462 | — | 1,538,513 | 4,038 | 298,240 | 3,374,684 | |||||||||||||||||||||
Ole G. Rosgaard Chief Operating Officer | 2021 | 602,123 | 178,204 | 1,190,999 | — | 97,822 | 2,069,148 | ||||||||||||||||||||||
| 2020 | 550,000 | — | 190,989 | — | 499,388 | — | 18,968 | 1,259,345 | |||||||||||||||||||||
| 2019 | 506,628 | — | 348,826 | — | 759,907 | — | 21,580 | 1,636,941 | |||||||||||||||||||||
Gary R. Martz Executive Vice President, General Counsel and Secretary | 2021 | 626,663 | 246,148 | 1,216,686 | 1,389,001 | 14,145 | 3,492,643 | ||||||||||||||||||||||
| 2020 | 610,655 | — | 287,609 | — | 646,556 | 777,343 | 14,018 | 2,336,181 | |||||||||||||||||||||
| 2019 | 599,149 | — | 545,472 | — | 1,045,020 | 1,235,282 | 13,180 | 3,438,103 | |||||||||||||||||||||
Michael Cronin Sr. Vice President, Enterprise Strategy and Global Sourcing and Supply Chain (6) | 2021 | 580,821 | 290,106 | 1,071,332 | 27,137 | 179,066 | 2,148,462 | ||||||||||||||||||||||
| 2020 | 592,734 | — | 182,598 | 508,264 | 51,958 | 140,974 | 1,476,528 | ||||||||||||||||||||||
| 2019 | 581,878 | — | 401,690 | — | 795,117 | 62,576 | 127,689 | 1,968,950 | |||||||||||||||||||||
(1) The amounts of base salary for fiscal 2019, 2020 and 2021 reflect actual amounts paid to the respective NEO for each fiscal year ended October 31. As discussed in “Compensation Discussion and Analysis - Elements of Our Compensation Program - Base Salary” above, we implement base salary increases on a calendar year rather than a fiscal year basis.
(2)Amounts represent the restricted share portion of the 2006 LTIP awards, as described below (see footnote 3 below) and as discussed in the “Compensation Discussion and Analysis - Long-Term Incentive Plan” above, based upon the dollar amount recognized for financial statement reporting purposes during fiscal 2021, 2020, and 2019, respectively, computed in accordance with Accounting Standards Certification (“ASC”). 718. For a discussion of the relevant ASC 718 valuation assumptions, see Note 1 in the Consolidated Financial Statements included in Item 8 of the 2021 Form 10-K. For fiscal 2021, 2020 and 2019, LTIP award payout amounts in this table for fiscal 2021 and not for other purposes were determined by multiplying the closing price of our shares of Class A Common Stock on December 13, 2021 ($59.60), December 31, 2020 ($46.88), and December 31, 2019 ($44.20), respectively, by the number of shares granted or to be granted.
(3)Amounts represent the cash awards earned under the STIP and 2006 LTIP. See “Compensation Discussion and Analysis - Elements of Our Compensation Program - Short-Term Incentive Plan” and “- Long-Term Incentive Plan.” The cash awards earned under the STIP and LTIP for fiscal 2021, 2020 and 2019 are as follows:
| Name | Fiscal Year | Short-Term Incentive Plan Awards ($) | Long-Term Incentive Plan Awards ($) | Total Non-Equity Incentive Plan Compensation Awards ($) | ||||||||||
| Peter G. Watson | 2021 | 2,725,000 | 747,833 | 3,472,833 | ||||||||||
| 2020 | 862,628 | 1,254,099 | 2,116,727 | |||||||||||
| 2019 | 1,258,008 | 2,083,340 | 3,341,348 | |||||||||||
| Lawrence A. Hilsheimer | 2021 | 1,433,486 | 308,495 | 1,741,981 | ||||||||||
| 2020 | 429,610 | 520,236 | 949,846 | |||||||||||
| 2019 | 615,441 | 923,072 | 1,538,513 | |||||||||||
| Ole G. Rosgaard | 2021 | 1,040,000 | 150,999 | 1,190,999 | ||||||||||
| 2020 | 268,554 | 230,834 | 499,388 | |||||||||||
| 2019 | 365,534 | 394,373 | 759,907 | |||||||||||
| Gary R. Martz | 2021 | 1,008,125 | 208,561 | 1,216,686 | ||||||||||
| 2020 | 298,984 | 347,572 | 646,556 | |||||||||||
| 2019 | 428,312 | 616,708 | 1,045,020 | |||||||||||
| Michael Cronin | 2021 | 781,226 | 290,106 | 1,071,332 | ||||||||||
| 2020 | 251,572 | 256,692 | 508,264 | |||||||||||
| 2019 | 340,968 | 454,149 | 795,117 | |||||||||||
Greif - Proxy Statement 34
| Name and Principal Position | Year | Salary ($)(1) | Bonus ($) | Stock Awards ($)(2) | Option Awards ($) | Non-Equity Incentive Plan Compensation ($)(3) | Change in Pension Value and Nonqualified Deferred Compensation Earnings ($)(4) | All Other Compensation ($)(5) | Total ($) | ||||||
Peter G. Watson President and Chief Executive Officer | 2018 | 1,022,323 | — | 2,735,452 | — | 4,780,419 | 1,636,340 | 12,559 | 10,187,093 | ||||||
| 2017 | 967,778 | — | 836,573 | — | 1,670,539 | 1,092,876 | 13,120 | 4,580,886 | |||||||
| 2016 | 834,617 | 75,000 | 171,981 | — | 1,450,095 | 935,632 | 9,272 | 3,476,597 | |||||||
Lawrence A. Hilsheimer Executive Vice President and Chief Financial Officer | 2018 | 699,560 | — | 1,285,379 | — | 2,231,261 | 11,640 | 335,766 | 4,563,606 | ||||||
| 2017 | 682,635 | — | 683,269 | — | 1,039,666 | 7,314 | 242,932 | 2,655,816 | |||||||
| 2016 | 662,500 | 13,000 | 200,823 | — | 917,646 | 3,258 | 249,776 | 2,047,003 | |||||||
Gary R. Martz Executive Vice President, General Counsel and Secretary (6) | 2018 | 584,223 | 75,000 | 860,395 | — | 1,513,423 | 526,890 | 12,955 | 3,572,886 | ||||||
| 2017 | 570,587 | — | 482,362 | — | 714,086 | 562,013 | 13,120 | 2,342,168 | |||||||
| 2016 | 555,240 | 10,920 | 153,056 | — | 674,732 | 645,817 | 13,225 | 2,052,990 | |||||||
Michael Cronin Senior Vice President and Group President (7) | 2018 | 538,196 | — | 631,056 | — | 1,213,841 | 33,323 | 118,812 | 2,535,228 | ||||||
| 2017 | 525,000 | — | 185,744 | — | 473,568 | 70,382 | 97,180 | 1,351,874 | |||||||
| 2016 | 508,475 | — | 39,457 | — | 604,218 | 14,062 | 113,074 | 1,279,286 | |||||||
Ole Rosgaard Senior Vice President and Group President | 2018 | 460,337 | — | 452,297 | — | 954,689 | — | 21,205 | 1,888,528 | ||||||
| 2017 | 404,040 | — | 150,211 | — | 419,711 | — | 10,320 | 984,282 | |||||||
| 2016 | 358,000 | 53,083 | — | — | 361,295 | — | 16,039 | 788,417 | |||||||
(4) Amounts represent the change in the pension value for each NEO, including amounts accruing under our pension plans, the SERP, the DC SERP, the NQSP and the NQDCP. During fiscal 2021, the Company accrued above market interest with respect to the DC SERP, a nonqualified defined contribution plan, for Mr. Hilsheimer in the amount of $39,510 which was equal to the difference between the interest accrued at 2.93% and that which would have accrued at 0.17% (120% of the long-term applicable federal rate for October 2020). During fiscal 2021, the Company accrued above market interest with respect to the NQSP, a nonqualified defined contribution plan, for Mr. Rosgaard in the amount of $736 which was equal to the difference between the interest accrued at 2.93% and that which would have accrued at 0.17% (120% of the long-term applicable federal rate for October 2020). None of the NEOs who participate in the NQDCP receive preferential or above market earnings. See " Executive Compensation Tables - Pension Benefits and Nonqualified Retirement and Deferred Compensation" for a description of all these plans.
| Name | Fiscal Year | Short Term Incentive Plan Awards ($) | Long Term Incentive Plan Awards ($) | Total Non-Equity Incentive Plan Compensation Awards ($) | |||||||
| Peter G. Watson | 2018 | 2,334,624 | 2,445,795 | 4,780,419 | |||||||
| 2017 | 1,078,111 | 592,428 | 1,670,539 | ||||||||
| 2016 | 1,283,401 | 166,694 | 1,450,095 | ||||||||
| Lawrence A. Hilsheimer | 2018 | 1,081,978 | 1,149,283 | 2,231,261 | |||||||
| 2017 | 548,964 | 490,702 | 1,039,666 | ||||||||
| 2016 | 722,982 | 194,664 | 917,646 | ||||||||
| Gary R. Martz | 2018 | 744,134 | 769,289 | 1,513,423 | |||||||
| 2017 | 372,496 | 341,590 | 714,086 | ||||||||
| 2016 | 526,332 | 148,400 | 674,732 | ||||||||
| Michael Cronin | 2018 | 649,609 | 564,232 | 1,213,841 | |||||||
| 2017 | 341,250 | 132,318 | 473,568 | ||||||||
| 2016 | 565,982 | 38,236 | 604,218 | ||||||||
| Ole Rosgaard | 2018 | 550,269 | 404,420 | 954,689 | |||||||
| 2017 | 275,876 | 143,836 | 419,711 | ||||||||
| 2016 | 361,295 | — | 361,295 | ||||||||
| Name | Year | 401(k) Match and Contribution ($)† | Company paid Life Insurance and other Premiums ($)†† | Value of Wellness Physical Exams ($) | DC SERP ($)††† | Perquisites and Other Personal Benefits ($)†††† | Total All Other Compensation ($) | |||||||||||||||
| Peter G. Watson | 2018 | 7,854 | 1,905 | 2,800 | — | — | 12,559 | |||||||||||||||
| 2017 | 8,100 | 2,220 | 2,800 | — | — | 13,120 | ||||||||||||||||
| 2016 | 4,147 | 2,325 | 2,800 | — | — | 9,272 | ||||||||||||||||
| Lawrence A. Hilsheimer | 2018 | 16,500 | 1,905 | 727 | 316,634 | — | 335,766 | |||||||||||||||
| 2017 | 8,100 | 2,220 | — | 232,612 | — | 242,392 | ||||||||||||||||
| 2016 | 7,665 | 2,325 | — | 239,786 | — | 249,776 | ||||||||||||||||
| Gary R. Martz | 2018 | 8,250 | 1,905 | 2,800 | — | — | 12,955 | |||||||||||||||
| 2017 | 8,100 | 2,220 | 2,800 | — | — | 13,120 | ||||||||||||||||
| 2016 | 8,100 | 2,325 | 2,800 | — | — | 13,225 | ||||||||||||||||
| Michael Cronin | 2018 | — | 38,162 | — | — | 80,650 | 118,812 | |||||||||||||||
| 2017 | — | 27,024 | — | — | 70,488 | 97,180 | ||||||||||||||||
| 2016 | — | — | — | — | 113,074 | 113,074 | ||||||||||||||||
| Ole Rosgaard | 2018 | 16,500 | 1,905 | 2,800 | — | — | 21,205 | |||||||||||||||
| 2017 | 8,100 | 2,220 | — | — | — | 10,320 | ||||||||||||||||
| 2016 | 10,914 | 2,325 | 2,800 | — | — | 16,039 | ||||||||||||||||
| Name | Year | 401(k) Match and Contribution ($)† | Company paid Life Insurance and other Premiums ($)†† | Value of Wellness Physical Exams ($) | DC SERP ($)††† | NQSP ($)†††† | Perquisites and Other Personal Benefit ($)††††† | Total All Other Compensation ($) | ||||||||||||||||||
| Peter G. Watson | 2021 | 8,700 | 1,758 | 3,600 | — | — | 87 | 14,145 | ||||||||||||||||||
| 2020 | 8,550 | 1,868 | 3,600 | — | — | — | 14,018 | |||||||||||||||||||
| 2019 | 8,796 | 1,905 | 2,800 | — | — | — | 13,501 | |||||||||||||||||||
| Lawrence A. Hilsheimer | 2021 | 17,400 | 1,758 | 790 | 360,514 | — | 4,752 | 385,214 | ||||||||||||||||||
| 2020 | 17,100 | 1,868 | 732 | 240,260 | — | 351,712 | 611,672 | |||||||||||||||||||
| 2019 | 16,800 | 1,905 | — | 279,460 | — | 75 | 298,240 | |||||||||||||||||||
| Ole G. Rosgaard | 2021 | 16,996 | 1,758 | 3,600 | — | 75,381 | 87 | 97,822 | ||||||||||||||||||
| 2020 | 17,100 | 1,868 | — | — | — | — | 18,968 | |||||||||||||||||||
| 2019 | 16,800 | 1,905 | 2,800 | — | — | 75 | 21,580 | |||||||||||||||||||
| Gary R. Martz | 2021 | 8,700 | 1,758 | 3,600 | — | — | 87 | 14,145 | ||||||||||||||||||
| 2020 | 8,550 | 1,868 | 3,600 | — | — | — | 14,018 | |||||||||||||||||||
| 2019 | 8,400 | 1,905 | 2,800 | — | — | 75 | 13,180 | |||||||||||||||||||
| Michael Cronin | 2021 | — | 43,462 | — | — | — | 135,604 | 179,066 | ||||||||||||||||||
| 2020 | — | 43,984 | — | — | — | 96,990 | 140,974 | |||||||||||||||||||
| 2019 | — | 37,898 | — | — | — | 89,791 | 127,689 | |||||||||||||||||||
† This column includes an additional matchretirement contribution for Messrs. Hilsheimer and Rosgaard who are U.S. employees not eligible to participate in the Pension Plan.U.S. pension plan. This additional employer contribution is equal to three percent of their eligible compensation.compensation subject to IRS limitations.
†† This column includes Company paid life insurance, accidental death and disability, and long-term disability and global medical and dental insurance and evacuation premiums.disability.
††† This column includes pay credits and non-above market interest credits accrued with respect to Mr. Hilsheimer's benefits under the DC SERP as of October 31, 2021 in the amount of $360,514. See “Executive Compensation Tables - Nonqualified Retirement and Deferred Compensation - Supplemental Executive Retirement Plan” for a description of the DC SERP.
†††† This column includes pay credits and non-above market interest credits accrued with respect to Mr. Rosgaard's benefits under the NQSP as of October, 31, 2021 in the amount of $75,381. See “Executive Compensation Tables - Nonqualified Retirement and Deferred Compensation - Supplemental Executive Retirement Plan” for a description of the NQSP.
††††† This column typically includes benefits related to expatriate assignments and other miscellaneous benefits. The amount for Messrs. Watson, Rosgaard and Martz in fiscal 2021 represents the amount of a holiday gift card provided to corporate employee in December 2020. The amounts for Mr. Cronin represents perquisites customary to his assignment in Europe, such as a pension contribution gap, tax preparation services and a housing allowance paid by the Company to or on behalf of Mr. Cronin as set forth below. Mr. Hilsheimer's amount in fiscal 2021, represents the amount of a holiday gift card provided to corporate employee in December 2020 and the amount paid by the Company for tax preparation services fee reimbursement related to the Company's 409A operational error and account distribution under the NQDCP that occurred in fiscal 2020.
| Pension Contribution Gap ($) | Tax Preparation ($) | Housing Allowance ($) | Total ($) | |||||||||||
| 2021 | 76,977 | 2,049 | 56,578 | 135,604 | ||||||||||
| 2020 | 55,882 | — | 41,108 | 96,990 | ||||||||||
| 2019 | 50,899 | — | 38,892 | 89,791 | ||||||||||
(6) Mr. Cronin’s compensation is paid in Euros and has been converted to U.S. Dollars using an exchange rate of 1.160564, 1.174 and 1.1112 for fiscal years 2021, 2020 and 2019, respectively.
Greif - Proxy Statement 35
| Pension Contribution Gap ($) | Tax Preparation ($) | Housing Allowance ($) | Total ($) | ||
| 2018 | 40,844 | — | 39,806 | 80,650 | |
| 2017 | 30,514 | 1,109 | 38,865 | 70,488 | |
| 2016 | 56,495 | 1,109 | 55,470 | 113,074 | |
The following table summarizes grants of non-equity and stock-based compensation awards made during fiscal 20182021 to the NEOs.
| Name | Grant Date (1) | Estimated Future Payouts Under Non-Equity Incentive Plan Awards (2) | Estimated Future Payouts Under Equity Incentive Plan Awards (3) | All Other Stock Awards: Number of Shares of Stocks (#)(4) | Grant Date Fair Value of Stock and Option Awards ($)(5) | ||||||||||||||||||||||||
Threshold ($) | Target ($) | Maximum ($) | Threshold (#) | Target (#) | Maximum (#) | ||||||||||||||||||||||||
| Peter G. Watson | |||||||||||||||||||||||||||||
| STIP | 12/17/2020 | 681,250 | 1,362,500 | 2,725,000 | |||||||||||||||||||||||||
| LTIP - RSUs | 12/17/2020 | 26,622 | 1,291,167 | ||||||||||||||||||||||||||
| LTIP - PSUs | 12/17/2020 | 22,438 | 67,995 | 135,990 | 3,210,724 | ||||||||||||||||||||||||
| Lawrence A. Hilsheimer | |||||||||||||||||||||||||||||
| STIP | 12/17/2020 | 358,372 | 716,743 | 1,433,486 | |||||||||||||||||||||||||
| LTIP - RSUs | 12/17/2020 | 13,504 | 654,944 | ||||||||||||||||||||||||||
| LTIP - PSUs | 12/17/2020 | 7,317 | 22,172 | 44,344 | 1,046,962 | ||||||||||||||||||||||||
| Ole G. Rosgaard | |||||||||||||||||||||||||||||
| STIP | 12/17/2020 | 237,600 | 475,200 | 950,400 | |||||||||||||||||||||||||
| LTIP - RSUs | 12/17/2020 | 8,288 | 401,968 | ||||||||||||||||||||||||||
| LTIP - PSUs | 12/17/2020 | 4,491 | 13,608 | 27,216 | 642,570 | ||||||||||||||||||||||||
| Gary R. Martz | |||||||||||||||||||||||||||||
| STIP | 12/17/2020 | 252,031 | 504,062 | 1,008,125 | |||||||||||||||||||||||||
| LTIP - RSUs | 12/17/2020 | 9,227 | 447,510 | ||||||||||||||||||||||||||
| LTIP - PSUs | 12/17/2020 | 5,000 | 15,150 | 30,300 | 715,383 | ||||||||||||||||||||||||
| Michael Cronin (6) | |||||||||||||||||||||||||||||
| STIP | 12/17/2020 | 197,652 | 395,304 | 790,608 | |||||||||||||||||||||||||
| LTIP - RSUs | 12/17/2020 | 6,069 | 294,347 | ||||||||||||||||||||||||||
| LTIP - PSUs | 12/17/2020 | 4,491 | 9,965.00 | 27,216 | 470,547 | ||||||||||||||||||||||||
(1) The date the RSUs and PSUs were granted to participates, including our NEOs.
(2) In fiscal 2021, each NEO was selected to participate in the STIP. The amounts represent the threshold (50%), target (100%) and maximum (200%) cash award opportunity under the STIP for the performance period beginning November 1, 2020 and ending October 31, 2021. See “Compensation Discussion and Analysis - Elements of Our Compensation Program - Short-Term Incentive Plan.” The actual payments earned by each NEO in fiscal 2021 and paid in fiscal 2022 are shown in the Summary Compensation Table in the Non-Equity Incentive Plan Compensation column.
(3) In fiscal 2021, each NEO was selected to participate in the LTIP. The amounts represent the threshold (33%), target (100%) and maximum (200%) PSU award opportunity under the 2020 LTIP for the three-year performance period beginning November 1, 2020 and ending October 31, 2023. The PSUs granted may vest depending on performance results achieved during the performance period approximately three-years after the completion of the performance period subject to certain forfeiture events. See “Compensation Discussion and Analysis - Elements of Our Compensation Program - Long-Term Incentive Plan.”
(4) In fiscal 2021, each NEO was selected to participate in the LTIP. The amounts represent the RSU awards granted to each NEO under the 2020 LTIP for the performance period beginning November 1, 2020 and ending October 31, 2023. The RSUs granted are time-based and will vest on January 16, 2024 subject to certain forfeiture events. See “Compensation Discussion and Analysis - Elements of Our Compensation Program - Long-Term Incentive Plan.”
(5) The grant date fair market value of the RSUs and PSUs granted in fiscal 2021 were calculated in accordance with FASB ASC Topic 718 (excluding the effect of forfeitures) as of December 17, 2020. For RSUs, the market or payout value has been determined by multiplying the number of RSUs awarded by $48.50, the weighted average fair market value of the RSUs. For PSUs, the market or payout value has been determined by multiplying the number of PSUs awarded at target by $47.22, the weighted average fair market value of the PSUs.
(6) Mr. Cronin's awards are valued in Euros and have been converted to U.S. Dollars using an exchange rate of 1.160564 for STIP and 1.145785903 for LTIP - RSUs and PSUs.
Greif - Proxy Statement 36
| Name | Grant Date | Estimated Future Payouts Under Non-Equity Incentive Plan Awards(1)(2) | Estimated Future Payouts Under Equity Incentive Plan Awards | All Other Stock Awards: Number of Shares of Stocks (#) | All Other Option Awards: Number of Securities Underlying Options (#) | Exercise or Base Price of Option Awards ($/Sh) | Grant Date Fair Value of Stock and Option Awards ($) | |||||
Threshold ($) | Target ($) | Maximum ($) | Threshold (#) | Target (#) | Maximum (#) | |||||||
| Peter G. Watson | ||||||||||||
| Long term | 12/21//2017 | 1,121,670 | 3,399,000 | 6,798,000 | -- | -- | -- | -- | -- | -- | -- | |
| Short term | 12/21//2017 | 643,750 | 1,287,500 | 2,575,000 | -- | -- | -- | -- | -- | -- | -- | |
| Lawrence A. Hilsheimer | ||||||||||||
| Long term | 12/21//2017 | 463,312 | 1,403,976 | 2,807,952 | -- | -- | -- | -- | -- | -- | -- | |
| Short term | 12/21//2017 | 298,345 | 596,690 | 1,193,380 | -- | -- | -- | -- | -- | -- | -- | |
| Gary R. Martz | ||||||||||||
| Long term | 12/21//2017 | 309,541 | 938,002 | 1,876,004 | -- | -- | -- | -- | -- | -- | -- | |
| Short term | 12/21//2017 | 205,188 | 410,376 | 820,752 | -- | -- | -- | -- | -- | -- | -- | |
| Michael Cronin | ||||||||||||
| Long term | 12/21//2017 | 221,976 | 672,656 | 1,345,312 | -- | -- | -- | -- | -- | -- | -- | |
| Short term | 12/21//2017 | 174,891 | 349,781 | 699,562 | -- | -- | -- | -- | -- | -- | -- | |
| Ole Rosgaard | ||||||||||||
| Long term | 12/21//2017 | 192,582 | 583,583 | 1,167,166 | -- | -- | -- | -- | -- | -- | -- | |
| Short term | 12/21//2017 | 151,732 | 303,463 | 606,926 | -- | -- | -- | -- | -- | -- | -- | |
Equity Compensation Plan Information |
The following table summarizes the number of securities remaining available for future issuance under each approved equity compensation plan as of October 31, 2021.
| Plan Category | Number of Securities to be Issued Upon Exercise of Outstanding Options | Weighted Average Exercise Price of Outstanding Options | Number of Securities Remaining Available for Future Issuance Under Equity Compensation Plans | ||||||||
Equity Compensation Plans Approved by Security Holders (1) | — | — | |||||||||
| 2001 Plan (2) | — | — | 3,990,000 | ||||||||
| 2005 Outside Directors Equity Award Plan (3) | — | — | 65,238 | ||||||||
| 2006 LTIP (4) | — | — | 516,473 | ||||||||
| 2020 LTIP (5) | — | — | 5,000,000 | ||||||||
| Equity Compensation Plans Not Approved by Security Holders | — | — | — | ||||||||
| Total: | — | — | — | ||||||||
(1) Information as of October 31, 2021. See “Compensation Discussion and Analysis - Elements of Our Compensation Program - Long-Term Incentive Plan” for a description of the 2020 LTIP and “Director Compensation for Fiscal 2021 - Director Compensation Arrangements” for a description of the 2005 Outside Director Equity Award Plan.
(2) The 2001 Management Equity Incentive and Compensation Plan (the "2001 Plan") provides for the award of incentive and nonqualified stock options and restricted and performance shares of Class A Common Stock to key employees. The 2001 Plan contains a formula for calculating the number of shares available for future issuance. This formula provides that the maximum number of shares which may be issued each calendar year under the 2001 Plan is equal to the sum of (a) 5.0% of the total outstanding shares as of the last day of our immediately preceding fiscal year, plus (b) any shares related to awards under the 2001 Plan that, in whole or in part, expire or are unexercised, forfeited, or otherwise not issued to a participant or returned to the 2001 Plan, plus (c) any unused portion of the shares available under (a), above, for the immediately preceding two fiscal years as a result of not being made subject to a grant or award in such preceding two fiscal years. The approximate number of shares that may be issued under the 2001 Plan in fiscal 2021 is 3,990,000 shares. The maximum number of shares that may be issued under the 2001 Plan with respect to incentive stock options is 5,000,000 shares, with 1,072,311 shares remaining available for future issuance under this limitation. Stock options have not been issued under the 2001 Plan since 2006.
(3) Shares of our Class A Common Stock may be issued under the 2005 Outside Directors Equity Award Plan.
(4) Shares of our Class A and/or B Common Stock may be awarded under the 2006 LTIP. At the 2020 annual meeting, stockholders approved adding 750,000 shares to the 2006 LTIP. On February 28, 2020, 153,275 shares were issued for the 2017-2019 performance period. On January 19, 2021, 80,252 shares were issued for the 2018-2020 performance period. On December 16, 2021, 46,518 shares were issued for the 2019-2021 performance period.
(5) Shares of our Class A and/or B Common Stock may be awarded under the 2020 LTIP. To date, no shares have been issued under the 2020 LTIP, As of October 31, 2021, 144,380 and 131,522 RSUs and 253,866 and 240,235 PSUs were granted under the 2020 LTIP for the 2020-2022 and the 2021-2023 performance periods, respectively. These amounts do not include cash equivalent RSUs and PSUs issued to participants in select countries where impediments exist related to the issuance of stock. Stock units are subject to forfeiture upon termination of employment and for failure to achieve performance targets. Stock awards under the 2020 LTIP will not occur until after fiscal year-end 2022.
| Outstanding Equity Awards at Fiscal Year-End 2021 | ||
| Name | Stock Awards | |||||||||||||
| Numbers of Shares or Units of Stock that have not Vested (#) (1) | Market Value of Shares or Units of Stock that have not Vested ($) (2) | Equity Incentive Plan Awards: Number of Unearned Shares, Units or Other Rights that have not Vested (#) (3) | Equity Incentive Plan Awards: Market or Payout Value of Unearned Shares Units or Other Rights that have not Vested ($) (4) | |||||||||||
| Peter G. Watson | 54,935 | 3,568,578 | 137,822 | 8,952,917 | ||||||||||
| Lawrence A. Hilsheimer | 28,354 | 1,841,876 | 45,716 | 2,969,711 | ||||||||||
| Ole G. Rosgaard | 16,020 | 1,040,659 | 25,867 | 1,680,320 | ||||||||||
| Gary R. Martz | 19,374 | 1,258,535 | 31,238 | 2,029,220 | ||||||||||
Michael Cronin (5) | 12,715 | 825,966 | 20,502 | 1,331,810 | ||||||||||
(1) Represents the total number of RSUs granted under the 2020 LTIP for the 2020-2022 and 2021-2023 performance period. The 2020-2022 RSUs vest on January 15, 2023 and the 2021-2023 RSUs vest on January 16, 2024.
(2) Represents the market or payout value of the RSUs determined by multiplying the closing price of our shares of Class A Common Stock on October 29, 2021 ($64.96) by the number of RSUs granted.
(3) Represents the total number PSUs granted at the target performance level under the 2020 LTIP for the 2020-2022 and 2021-2023 performance period performance period. The PSU vesting date will be specified by the Compensation Committee following the end of fiscal 2018, there were no stock-based compensation awards outstandingthe performance period. The vesting date for the NEOs. As discussed in “Stock-based Compensation” above, since 2006, we have not issued stock options2020-2022 PSUs will be no sooner than January 14, 2023 and no later than March 15, 2023 and the vesting date for the 2021-2023 PSUs will be no sooner than January 14, 2024 and no later than March 15, 2024.
Greif - Proxy Statement 37
(4) Represents the market or made stock awards to its executive officers or employees, including the NEOs, other than as a componentpayout value of the PSUs determined by multiplying the closing price of our shares of Class A Common Stock on October 29, 2021 ($64.96) by the number of PSUs granted at target performance level.
(5) Mr. Cronin's awards are valued in Euros and have been converted to U.S. Dollars using an exchange rate of 1.141023611 and 1.1145785903 for the 2020 LTIP or in certain circumstances, as a component of compensation packages offered to attract new key employees.
for the 2020-2022 and 2021-2023 performance periods, respectively.
| Option Exercises and Stock Vested in Fiscal 2021 | ||
2021.
| Pension Benefits | ||
Pension Plans
We have a tax-qualified defined benefit plan that is intended to meet the requirements of Section 401(a) of the Code for our U.S. employees hired prior to November 1, 2007, who have long and continuous service before retirement. Benefits payable under this pension plan are funded entirely through Company contributions to a trust fund. This pension plan provides for a lump sum payment or a monthly benefit for the participant’s lifetime upon reaching the normal retirement age under this pension plan, which is 65. The monthly benefit is calculated by multiplying the participant’s annual average compensation (calculated using the five highest complete years of the last ten years of compensation or the final sixty months of compensation, whichever is higher, capped at Code limits) by 35% and by the participant’s years of service divided by the years the participant could have worked until his or her normal retirement date divided by 12. “Compensation” for purposes of the pension plan includes base salary and payments under the STIP. Participants are 100% vested in this pension plan once they have been credited with five years of service with the Company. Messrs. Watson and Martz are the only NEOs eligible to participate in this pension plan, and both are fully vested in their benefits under this pension plan. Once a participant is fully vested, the participant will have earned a nonforfeitable right to a benefit under this pension plan. Benefits may commence at the later of age 65 or five years vested in this pension plan. This pension plan offers early retirement benefits at age 55 on a reduced basis with a required 15 years of service. Messrs. Watson and Martz are both eligible for early retirement benefits under this pension plan.
Mr. Cronin participates in pension plans sponsored by a subsidiary of the Company in the Netherlands. Benefits payable under these pension plans are funded entirely through such subsidiary's contributions to a trust fund. These pension plans provide benefits to Mr. Cronin upon his reaching the normal retirement age under Dutch law, which is 68. Benefits accrue at the rate of 1.875% and 1.75%, respectively, per year of service on separate portions of a participant's base salary subject to limitations imposed by Dutch law. Participants under the plans vest in their benefits immediately. Therefore, Mr. Cronin is fully vested in the benefits of these pension plans. Mr. Cronin’s pension plans do not offer early retirement benefits.
Supplemental Executive Retirement Plan
Our SERP provides benefits for a select group of executive officers, including our NEOs, who participate in the above described pension plan. The plan is considered to be an “unfunded” arrangement as amounts generally will not be set aside or held by the Company in a trust, escrow, or similar account. The benefit from the pension plan and the SERP is equal to a target percentage (ranging from 40% to 50% depending on job classification) times the executive officer’s highest three-year average compensation of the last five years worked by the executive officer and reduced for less than 20 years of continuous service and for receiving benefits prior to the executive officer’s normal retirement age. “Compensation” for purposes of the SERP includes base salary and payments under the STIP, and benefits are payable quarterly under the SERP for 15 years. “Normal retirement age” under the SERP is 65. Generally, vesting under the SERP requires 10 years of service or the attainment of the normal retirement age. Messrs. Watson and Martz are the only NEOs eligible to participate in the SERP, and both are fully vested in their benefits under the SERP.
Pension Benefits in Fiscal 2021
The table below sets forth the years of service and present value of the accumulated benefit for each of the eligible NEOs under the Pension Plan and other pension plans sponsored by subsidiaries of the Company and the SERPdescribed above as of October 31, 2018.2021. Messrs. Hilsheimer and Rosgaard are not participantseligible to participate in a Company sponsoredour pension plan.plans or SERP.
| Name | Plan Name | Number of Years Credited Service (#) | Present Value of Accumulated Benefit ($) (1)(2)(3) | Payments During Last FY ($) | ||||||||||
| Peter G. Watson | U.S. Pension Plan | 22 | 1,078,235 | — | ||||||||||
| SERP | 10 | 8,803,225 | — | |||||||||||
| Gary R. Martz | U.S. Pension Plan | 20 | 945,259 | — | ||||||||||
| SERP | 20 | 6,415,856 | — | |||||||||||
| Michael Cronin | Netherlands Pension Plan | 7 | 267,026 | — | ||||||||||
Greif - Proxy Statement 38
| Name | Plan Name | Number of Years Credited Service (#) | Present Value of Accumulated Benefit ($) (1)(2)(3) | Payments During Last Fiscal Year ($) | |||
| Peter G. Watson | Pension Plan | 19 | 654,905 | — | |||
| SERP | 7 | 3,566,626 | — | ||||
| Gary R. Martz | Pension Plan | 17 | 554,655 | — | |||
| SERP | 17 | 3,404,804 | — | ||||
| Michael Cronin | Netherlands Pension | 4 | 125,355 | — | |||
| SERP | — | — | — | ||||
(A) Age 65 commencement for Messrs. Watson and Martz and age 67 commencement for Mr. Cronin;
(B) No decrements for death nor termination prior to age 65;
(C) RP-2014 Projected MortalityThe mortality assumption for the Pension Plan. ForU.S. pension plan uses Pri-2012 projected forward using the MP-2021 and MP-2020 projected scale as of October 31, 2021, and 2020, respectively, and MP-2019 to an ultimate annual improvement rate of 0.75% using the Society's of Actuaries mortality table modeling as of October 31, 2019. The mortality tables used for the Netherlands Pension,pension plans is the AP Prognosetafel 2016AG 2020 mortality table as of October 31, 20172021, and 2016, respectively;2020, and the AP Prognosetafel AG 2018 mortality table as of October 31, 2018;2019.
(D) Discount rates for the Pension PlanU.S. pension plan of 4.61%, 3.28%2.93% 3.01% and 3.28%3.33% as of October 31, 2018, 20172021, 2020 and 2016,2019, respectively; and discount rates for the SERP of 4.38%2.50%, 3.42%2.29% and 3.36%2.93% as of October 31, 2018, 20172021, 2020 and 2016,2019, respectively; and discount rates for the Netherlands pension plans of 1.13%, 0.75% and 0.75% as of October 31, 2021, 2020 and 2019, respectively.
(2) See Note 12 in the Notes to Consolidated Financial Statements included in Item 8 of the 2021 Form 10-K for a discussion of the valuation method and material assumptions applied in quantifying the present value of the accumulated benefit.
(3) Mr. Cronin’s Netherlands Pension benefits were calculated in Euros and converted to U.S. Dollars using an exchange rate of 1.1606, 1.1745, and 1.1112 for fiscal years 2021, 2020 and 2019, respectively.
| Nonqualified Retirement and Deferred Compensation | ||
Supplemental Executive Retirement Plan
We have a defined contribution supplement executive retirement plan ("DC SERP") for certain executive officers who are not eligible to participate in the pension plan. We accrue an amount equal to a specified percentage of the executive officer's base salary and annual short-term incentive plan bonus payments. This account is also credited annually with interest based on the discount rate used under the U.S. pension plan. Vesting under the DC SERP requires 10 years of service or the attainment of age 65. Vested executive officers are entitled to the payment of a future benefit upon retirement equal to the accrued amounts and credited interest, which is payable in equal installments quarterly over 15 years.
The table below sets forth certain information concerning Mr. Hilsheimer's benefits under the DC SERP as of October 31, 2021. Mr. Hilsheimer is the only NEO currently participating in the DC SERP. He is not fully vested in his accumulated benefit under the DC SERP.
| Name | Plan Name | Number of Years Credited Service (#) | Value of Pay Credits and Above Market Interest in Last FY ($)(1) | Present Value of Accumulated Benefit ($) (2)(3) | Payments During Last FY ($) | ||||||||||||
| Lawrence A. Hilsheimer | DC SERP | 7 | 392,502 | 2,002,057 | — | ||||||||||||
(1) The amount in this column represents pay credits and non-above market interest credits accrued during fiscal 2021 under the DC SERP. This amount is also included in Mr. Hilsheimer's fiscal 2021 compensation in the Summary Compensation Table.
(2) The amount in this column represents the total value of pay credits and non-above market interest accrued under the DC SERP. This amount is not included in Mr. Hilsheimer's fiscal 2021 compensation in the Summary Compensation Table.
(3) The mortality assumption for the DC SERP uses Pri-2012 projected forward using the MP-2021 projected scale as of October 31, 2021 and a discount rate for the Netherlands PensionDC SERP of 1.65%, 1.55% and 1.32%2.93% as of October 31, 2018, 20172021.
Greif - Proxy Statement 39
Nonqualified Supplemental Deferred Compensation Plan
We have a nonqualified supplemental deferred compensation plan ("NQSP") for certain executive officers who do not participate in the SERP or DC SERP described above. This plan credits eligible officers who are employed on December 31 of each calendar year with a contribution equal to the maximum employer contribution rate under the Company's 401(k) Plan, multiplied by the excess, if any, of the sum of the officer's base salary and 2016, respectively.
The table below providessets forth certain information regardingconcerning Mr. Rosgaard's benefits under the NEOs accounts under our Non-qualified Deferred Compensation PlanNQSP as of October 31, 2018. Messrs. Hilsheimer and2021. Mr. Rosgaard areis the only NEO currently participating in the NQSP. He is not fully vested in his accumulated benefit under the NQSP.
| Name | Plan Name | Number of Years Credited Service (#) | Value of Pay Credits and Above Market Interest in Last FY ($)(1) | Present Value of Accumulated Benefit ($) (2)(3) | Payments During Last FY ($) | ||||||||||||
| Ole G. Rosgaard | NQSP | 1 | $76,072 | $102,795 | — | ||||||||||||
(1) The amount in this column represents pay credits and non-above market interest credits accrued during fiscal 2021 under the NQSP. This amount is also included in Mr. Rosgaard's fiscal 2021 compensation in the Summary Compensation Table.
(2) The amount in this column represents the total value of pay credits and non-above market interest accrued under the NQSP. This amount is not included in Mr. Rosgaard's fiscal 2021 compensation in the Summary Compensation Table.
(3) The mortality assumption for the NQSP uses Pri-2012 projected forward using the MP-2021 projected scale as of October 31, 2021 and a discount rate for the NQSP of 2.93% as of October 31, 2021.
Nonqualified Deferred Compensation Plan
We have a NQDCP for our executive officers, including our NEOs, that have electedwhich provides a vehicle for our executive officers to elect to defer their compensation. This plan is intended to meet the requirements of Section 409A of the Code. A participant’s base salary, STIP and LTIP cash payments are all eligible for deferral under this plan, and participants may defer up to 100% of their compensation. We do not currently match any compensation deferred by participants or provide any other discretionary contributions under this plan. A participant’s deferred compensation (along with company-match or contributions, if any) is deposited into an account with a rabbi trust to protect and segregate such funds. Deferred funds are invested in a similar range of investment options as are available in our 401(k) plan. The funds in a participant’s account are distributed to a participant upon his or her retirement in a lump sum or in equal annual installments over a five- or ten-year period, as elected by the participant, or in a lump sum upon a participant’s termination of employment, death or disability or a change in control of the Company. Subject to the terms of the plan, participants may also receive a distribution of funds for an “unforeseeable emergency.” A participant is fully vested in his or her own deferral contributions, but the right to Company-matching contributions, if any, is subject to vesting as provided by this plan.
Nonqualified Deferred Compensation Benefits in Fiscal 2021
The table below sets forth certain information concerning Mr. Rosgaard's benefits under the NQDCP as of October 31, 2021. Mr. Rosgaard is the only NEO that has elected and deferred compensation under our Non-qualified Deferredthe NQDCP. He is fully vested in his aggregate balance under the NQDCP.
| Name | Plan Name | Executive Contributions in Last FY ($)(1)(2) | Company Contributions in Last FY ($) | Aggregate Earnings in Last FY ($) | Aggregate Withdrawals/ Distributions ($) | Aggregate Balance at FYE ($) | ||||||||||||||
| Ole G. Rosgaard | NQDCP | 11,542 | — | — | — | 200,638 | ||||||||||||||
(1)The amount shown only includes LTIP cash awards deferred during fiscal 2021.
(2)The amount shown is also included in Mr. Rosgaard's fiscal 2021 compensation in the Summary Compensation Plan.Table.
| Name | Executive Contributions in Last FY ($)(1)(2) | Company Contributions in Last FY ($) | Aggregate Earnings in Last FY ($) | Aggregate Withdrawals/ Distributions ($) | Aggregate Balance at Last FYE ($)(3) | ||
| Lawrence A. Hilsheimer | 54,225 | — | 7,803 | — | 307,154 | ||
| Ole Rosgaard | 59,256 | — | 263 | — | 59,520 | ||
| Potential Payments Upon Termination or Change in Control | ||
We have no plans, agreements, contracts or other arrangements providing any NEOof our NEOs with severance or change-in-control benefits.
| Agreements with NEOs | ||
We do not have an employment agreementagreements with any NEO.of our NEOs. All NEOs, as well as all other participants in the LTIP, have agreed to certain post-employment covenants prohibiting them from becoming involved in any enterprise which competes with any business engaged in by the Companyus or itsour subsidiaries.
Greif - Proxy Statement 40
| Pay Ratio | ||
Pursuant to Item 402(u) of RegulationRegulation S-K, for fiscal 2018,2021, the ratio of the total annual compensation of our CEO to the total annual compensation of the median employee was 305187 to 1.
To identify the median employee, we first determined our global employee population consisting of full-time, part-time, seasonal and temporary employees as of October 1, 2018.28, 2021. We excluded all employees in IndiaEgypt (40), Guatemala (13), Malaysia (75), Nigeria (2), Kazakhstan (1), Morocco (68), Nigeria (22), Poland (68),Ukraine (385) and Ukraine (481)Vietnam (246) under the de minimus exception, as the aggregate number of employees in those countries (642)(761) represents less than 5% of our total global employee population of 12,396.15,737. After determining our global employee population, we then used the annual base salary reflected in our internal payroll system, converted into U.S. dollars, as our consistently applied compensation measure. We next annualized the compensation of all permanent employees who joined the Company during the fiscal year.
Once the median employeeemployees were identified (we have two due to the fact that our population, excluding our CEO, was identified,an even number), we calculated the median employee’semployees' compensation using the same methodology used to calculate the total compensation of theour CEO as set forth in the Summary Compensation Table.Table and average the two numbers. The average median employee’semployee annual total compensation was $33,407.$43,200. The annual total compensation of our CEO was $10,187,092$8,098,389 as set forth in the Summary Compensation Table of this proxy statement.
Greif - Proxy Statement 41
AUDIT COMMITTEE MATTERS
Report of the Audit Committee
The Audit Committee is responsible for monitoring and reviewing our financial reporting process on behalf of the Board of Directors.Board. The Audit Committee consists of four independent directors. The Company’s Board of Directors has determined that all Audit Committee members are “financially literate” as defined by the NYSE standards and that Bruce A. Edwards qualifies as an “audit committee financial expert” as defined by applicable SEC regulations. Management has the primary responsibility for the financial statements and the reporting process, including the system of internal controls and preparation of the consolidated financial statements in accordance with generally accepted accounting principles in the United States (“GAAP”). In fulfilling its responsibilities, the Audit Committee reviewed the audited consolidated financial statements in the 20182021 Form 10-K with management, including a discussion of the quality, not just the acceptability, of the accounting principles, the reasonableness of significant judgments, and the clarity of disclosures in the consolidated financial statements. Throughout the year, the Audit Committee also monitored the results of the testing of internal control over financial reporting pursuant to §404 of the Sarbanes-Oxley Act of 2002, reviewed a report from management and internal audit regarding the design, operation and effectiveness of internal control over financial reporting, and reviewed a report from Deloitte & Touche LLP regarding the effectiveness of internal control over financial reporting. The Audit Committee reviewed with the independent auditors, who are responsible for expressing an opinion on the conformity of those audited consolidated financial statements with GAAP, their judgments as to the quality, not just the acceptability, of our accounting principles and such other matters as are required to be discussed with the Audit Committee in accordance with the standards of the Public Company Accounting Oversight Board (United States) (“PCAOB”). In addition, the Audit Committee received written disclosures regarding the independent auditors’ independence from management and the Company, and received a letter confirming that fact from the independent auditors, which included applicable requirements of the PCAOB regarding the independent accountant’s communications with the Audit Committee concerning independence and considered the compatibility of nonaudit services with the auditors’ independence.
The Audit Committee discussed with our internal and independent auditors the overall scope and plans for their respective audits. The Audit Committee meets separately with the internal and independent auditors, with and without management present, and separately with management, to discuss the results of their examinations, their evaluations of our internal controls and the overall quality of our financial reporting.
As discussed above, the Audit Committee is responsible for monitoring and reviewing our financial reporting process. It is not the duty or responsibility of the Audit Committee to conduct auditing or accounting reviews or procedures. Members of the Audit Committee are not employees of the Company. Therefore, the Audit Committee has relied, without independent verification, on management’s representation that the consolidated financial statements have been prepared with integrity and objectivity and in conformity with GAAP and on the representations of the independent auditors included in their report on our consolidated financial statements. The Audit Committee’s review does not provide its members with an independent basis to determine that management has maintained appropriate accounting and financial reporting principles or policies, or appropriate internal controls and procedures designed to assure compliance with accounting standards and applicable laws and regulations. Furthermore, the Audit Committee’s considerations and discussions with management and the independent auditors do not assure that our consolidated financial statements are presented in accordance with GAAP, that the audit of our consolidated financial statements has been carried out in accordance with the standards of the PCAOB, or that our independent auditors are in fact “independent.”
The Audit Committee receives regular reports from our General Counsel with respect to matters coming within the scope of our Code of Business Conduct and Ethics.Conduct. The CEO and the principal financial officer have each agreed to be bound by the Code of Business Conduct and Ethics and the Sarbanes-Oxley Act mandated Code of Ethics for Senior Financial Officers. The Company has also implemented and applied the Code of Business Conduct and Ethics throughout the Company. It also has in place procedures for the receipt of complaints concerning our accounting, internal accounting controls, or auditing practices, including the confidential, anonymous submission by employees of the Company of concerns regarding questionable accounting or auditing practices.
In reliance on the reviews and discussions referred to above, the Audit Committee recommended to the Board (and the Board has approved) that the audited consolidated financial statements be included in the 20182021 Form 10-K for filing with the Securities and Exchange Commission. The Audit Committee has selected Deloitte & Touche LLP as our independent auditors for the 20192022 fiscal year.
Submitted by the Audit Committee of the Board of Directors.
Bruce A. Edwards, Committee ChairpersonChair
John F. Finn
John W. McNamara
Robert M. Patterson
Greif - Proxy Statement 42
Audit Committee Pre-Approval Policy
The Audit Committee is responsible for the appointment, compensation and oversight of the work of the independent auditors. As part of this responsibility, the Audit Committee is required to pre-approve the audit and permissible non-audit services performed by the independent auditors in order to assure that such services do not impair the auditors’ independence from the Company. The Securities and Exchange Commission has issued rules specifying the types of services that independent auditors may not provide to their audit client, as well as the audit committee’s administration of the engagement of the independent auditors. Accordingly, the Audit Committee has adopted a Pre-Approval Policy (the “Policy”), which sets forth the procedures and the conditions under which services proposed to be performed by the independent auditors must be pre-approved.
Pursuant to the Policy, certain proposed services may be pre-approved on a periodic basis so long as the services do not exceed certain pre-determined cost levels. If not pre-approved on a periodic basis, proposed services must otherwise be separately pre-approved prior to being performed by the independent auditors. In addition, any proposed services that were pre-approved on a periodic basis, but later exceed the pre-determined cost level would require separate pre-approval of the incremental amounts by the Audit Committee.
The Audit Committee has delegated pre-approval authority to the ChairpersonChair of the Audit Committee for proposed services to be performed by the independent auditors for up to $100,000 per engagement. Pursuant to such Policy, in the event the ChairpersonChair pre-approves services, the ChairpersonChair is required to report decisions to the full Audit Committee at its next regularly-scheduled meeting.
Fees of the Independent Registered Public Accounting Firm
Deloitte & Touche LLP served as our independent registered public accounting firm for the fiscal year ended October 31, 2018.2021. It is currently expected that a representative of Deloitte & Touche LLP will be present atattend the Annual Meeting via the live webcast, will have an opportunity to make a statement if such representative so desires and will be available to respond to appropriate questions from stockholders. Our Audit Committee has selected Deloitte & Touche LLP as our independent registered public accounting firm for the 20192022 fiscal year. Deloitte & Touche LLP was initially engaged by the Audit Committee as our independent registered public accounting firm in August 2014.
All services to be provided by our independent auditors are pre-approved by the Audit Committee, including audit services, audit-related services, tax services and certain other services. See “Audit Committee Pre-Approval Policy.” Aggregate fees billed to the Company for each of the fiscal years ended October 31, 20172021 and October 31, 20182020 by Deloitte & Touche LLP were as follows:
| Type of Service | 2021 | 2020 | ||||||
Audit Fees (1) | $6,453,000 | $6,790,000 | ||||||
Audit-Related Fees (2) | $602,000 | $687,000 | ||||||
Tax Fees (3) | $2,582,000 | $2,647,000 | ||||||
All Other Fees (4) | $6,000 | $17,000 | ||||||
| Total | $9,643,000 | $10,141,000 | ||||||
| Type of Service | 2018 | 2017 |
Audit Fees (1) | $6,575,000 | $6,640,000 |
Audit-Related Fees (2) | $506,000 | $305,000 |
Tax Fees (3) | $1,684,000 | $1,525,000 |
All Other Fees (4) | $43,000 | $61,000 |
Total | $8,808,000 | $8,531,000 |
(2)Comprises statutory audits of Company subsidiaries, employee benefit plan audits and consultations regarding financial accounting and reporting.
(3)Comprises services for tax compliance, tax planning and tax advice. Tax compliance includes services for compliance related tax advice, as well as the preparation and review of both original and amended tax returns for the Company and its consolidated subsidiaries. Tax compliance related fees represented $0, and $0 of the tax fees for fiscal years 2021 and 2020, respectively. The remaining tax fees primarily include tax planning.
(4)Comprises other miscellaneous services.
None of the services described under the headings “-Audit-Related“Audit-Related Fees,” “-Tax“Tax Fees,” or “-All“All Other Fees” above were approved by the Audit Committee pursuant to the waiver procedure set forth in 17 CFR 210.2-01 (c)(7)(i)(C).
Greif - Proxy Statement 43
OTHER MATTERS
Communications with the Board
Our Board believes it is important for stockholders to have a process to send communications to the Board. Accordingly, any stockholder or other interested party who desires to make his or her concerns known to the non-management directors or to the entire Board may do so by communicating with the chairpersonchair of the Audit Committee by e-mail to audit.committee@greif.com or in writing to Audit Committee Chairperson,Chair, Greif, Inc., 425 Winter Road, Delaware, Ohio 43015. All such communications will be forwarded to the non-management directors or the entire Board as requested in the communication.
The Nominating Committee is responsible for evaluating and recommending candidates to the Board. The Committee’s Charter sets forth certain specific, minimum qualifications that must be met by a Nominating Committee recommended nominee for a position on the Board, as well as qualities and skills that Board members must possess. The Nominating Committee determines, and reviews with the Board on an annual basis, the desired skills and characteristics for directors as well as the composition of the Board as a whole. This assessmentassessment considers director’s qualification as independent, as well as diversity, age, skill and experience in the context of the needs of the Board. The Nominating Committee seeks to achieve diversity of occupational and personal backgrounds and considers diversity as a factor in director nominations. The Nominating Committee views diversity in a broad context to include race, gender, ethnicity, geography, diversity of viewpoint, professional and industry experience, skills, education and personal expertise, among others. At a minimum, directors should share the values of the Company and should possess the following characteristics: high personal and professional integrity; the ability to exercise sound business judgment; an inquiring mind; and the time available to devote to Board activities and the willingness to do so. Ultimately,Ultimately, the Nominating Committee will select prospective Board members who the Nominating Committee believes will be effective, in conjunction with the other members of the Board, in collectively serving the long-term interests of the stockholders.
The Nominating Committee identifies potential director candidates through a variety of means, including recommendations from members of the Committee or the Board, suggestions from Company management, and stockholder recommendations. The Committee also may, in its discretion, engage director search firms to identify candidates. Stockholders may recommend director candidates for consideration by the Nominating Committee by submitting a written recommendation to the Secretary of the Company at 425 Winter Road, Delaware, Ohio 43015 (the “Recommendation Notice”). The Recommendation Notice must contain, at a minimum, the following: the name and address, as they appear on our books, and telephone number, of the stockholder making the recommendation, including information on the name, age, business address and residence address of nominee, principal occupation or employment, number of shares and class of stock owned, and if such person is not a stockholder of record or if such shares are owned by an entity, reasonable evidence of such person’s ownership of such shares or such person’s authority to act on behalf of such entity; the full legal name, address and telephone number of the individual being recommended, together with a reasonably detailed description of the background, experience and qualifications of that individual; a written acknowledgement by the individual being recommended that he or she has consented to that recommendation and consents to our undertaking of an investigation into that individual’s background, experience and qualifications in the event that the Nominating Committee desires to do so; the disclosure of any relationship of the individual being recommended with the Company or any of its subsidiaries or affiliates, whether direct or indirect; and, if known to the stockholder, any material interest of such stockholder or individual being recommended in any proposals or other business to be presented at our next annual meeting of stockholders (or a statement to the effect that no material interest is known to such stockholder).
Except for the director nominees recommended by the Nominating Committee to the Board, no person may be nominated for election as a director of the Company during any stockholder meeting unless such person was first recommended by a stockholder for Board membership in accordance with the procedures set forth in the preceding paragraph and our Third Amended and Restated By-Laws, and the Recommendation Notice was received by us not lesslater than 60 daysthe close of business on the 90th day nor moreearlier than 90 daysthe 120th day prior to the anniversary date of such meeting;the immediately preceding annual meeting of stockholders; provided, however, if less than 75 days’ noticethat in the event that no annual meeting was held in the previous year or prior public disclosure of the date of a stockholders’annual meeting is givenmore than 30 days before or made to stockholders, then, in orderafter such anniversary date, the Recommendation Notice by the stockholder to be timely received, the Recommendation Notice must be received by us no later than the close of business on the 10th day following the day on which such notice of the date of the stockholders’ meeting was mailed or such public disclosure of the date of the annual meeting was made.made, whichever occurs first.
Stockholder Proposals
Proposals of stockholders intended to be presented at the 20202023 annual meeting of stockholders (scheduled for(expected to be February 25, 2020)28, 2023) must be received by us for inclusion in the proxy statement and form of proxy on or prior tono earlier than 120 days and no less than close of business on the 90th day in advance of the first anniversary of the date of this proxy statement.the last annual shareholder meeting. If a stockholder intends to present a proposal at the 20202023 annual meeting of stockholders, but does not seek to include such proposal in our proxy statement and form of proxy,proxy, such proposal must be received by us on or prior to 45 days in advance of the first anniversary of the date of this proxy statement or the persons named in the form of proxy for the 20202023 annual meeting of stockholders will be entitled to use their discretionary voting authority should such proposal then be raised at such meeting, without any discussion of the matter in our proxy
Greif - Proxy Statement 44
statement or form of proxy. Furthermore, stockholders must follow the procedures set forth in Article I, Section 8,1.8, of our SecondThird Amended and Restated By-Laws, as amended, in order to present proposals at the 20202023 annual meeting of stockholders.
Certain Relationships and Related Party Transactions
We have a written policy for the approval of a transaction between the Company and one of its directors, executive officers, greater than 5% Class B stockholders, an entity owned or controlled by such persons, or an immediate family member of such persons, which is generally referred to as a related party transaction. This policy provides that the Audit Committee must review, evaluate and approve or disapprove all related party transactions involving an amount equal to or greater than $5,000. This policy also requires that all related party transactions be disclosed in our applicable filings as required by the Securities Act of 1933 and the Securities Exchange Act of 1934 and related rules. In addition, the Nominating Committee, which advises the Board of Directors on corporate governance matters, independently reviews and assesses corporate governance issues related to contemplated related party transactions.
During fiscal 2018,2021, we retained the law firm of Baker & Hostetler LLP to perform certain legal services on itsour behalf. Daniel J. Gunsett, a partner in that firm for the first two months of fiscal 2021, is a director of the Company and a member of the Compensation, Nominating and Stock Repurchase Committees. We anticipate retaining Baker & Hostetler LLP in the 20192022 fiscal year. The fees for legal services rendered in fiscal 2021 were less than $300,000. Mr. Gunsett retired from Baker & Hostetler LLP in December 2020. The Board has affirmatively determined that Mr. Gunsett meets the categorical standards of independence adopted by the Board and is an independent director as defined in the NYSE listing standards. See “Corporate Governance-Director Independence.”
Other Information
The proxy card enclosed with this proxy statement is solicited from Class B stockholders by and on behalf of the Board of Directors of the Company. A person giving the proxy has the power to revoke it.
The expense for soliciting proxies for this Annual Meeting is to be paid by us. Solicitations of proxies also may be made by personal calls upon or telephone or telegraphic communications with stockholders, or their representatives, by not more than five officers or regular employees of the Company who will receive no compensation for doing so other than their regular salaries.
Management knows of no matters to be presented at the Annual Meeting other than the above proposals. However, if any other matters properly come before the Annual Meeting, it is the intention of the persons named in the accompanying form of proxy to vote the proxy in accordance with their judgment on such matters.
| /s/ Gary R. Martz | ||||||||
Gary R. Martz | ||||||||
| Corporate Secretary | ||||||||
| January | ||||||||
Greif - Proxy Statement 45
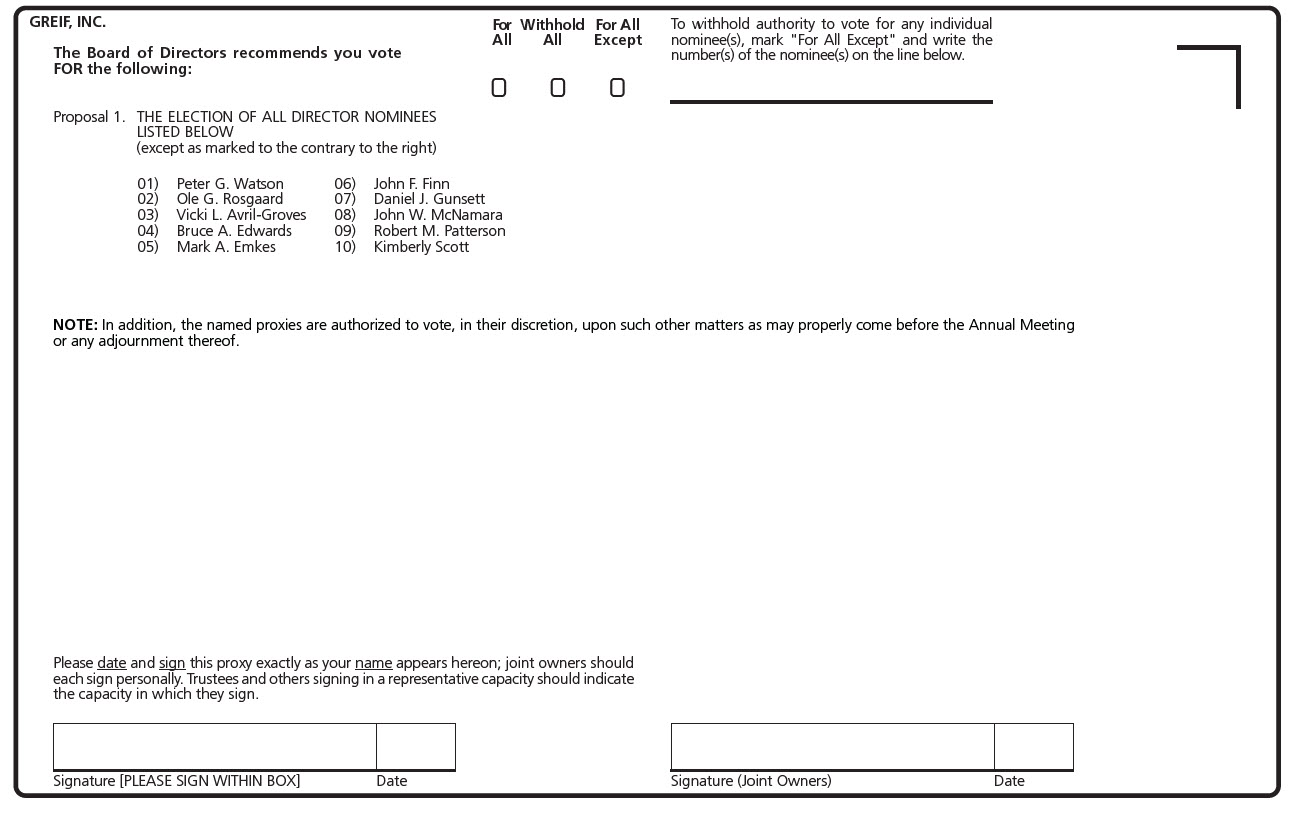
Greif - Proxy Statement 46